
Alter Domus previously demonstrated through a concise example how total credit losses from an underlying collateralized loan obligation (CLO) portfolio would equate to the total credit losses across the CLO’s notes, including the CLO equity tranche. This significant analysis considers various factors such as spreads, rate, and debt.
In that same research Alter Domus pointed out, however, that CLOs typically include structural features where excess interest, which would otherwise have been distributed in traditional portfolios, such as bank balance sheets or insurance company general accounts, can be diverted to provide credit support for CLO tranches upon an economic downturn.
This diversion of excess interest income means that total portfolio credit losses are reduced by the amount of excess interest diverted. In particular, the formula in estimating CLO tranche credit losses, as a function of the portfolio credit losses, is: Losses Allocated to CLO Tranches = Total Portfolio Credit Losses – Excess Interest
In this article, we expand our previous research by analyzing the impact of the relative benefit of excess interest, which is highly dependent on the overcollateralization (OC) test. This test translates to reduced expected loss (EL) of the underlying loan portfolio and increased investment value.
Specifically, the purpose of our research is to estimate the ‘Excess Interest’ from the formula above. As expected, we find that excess interest can mitigate credit losses in the underlying portfolio, but the extent to which is sensitive to several variables, such as the average credit quality of the portfolio, the available amount of excess interest over the life of the CLO, and portfolio weighted average life (WAL).
The results of our research indicate that a reasonable range of the reduction in portfolio EL can be from 6%-14%, with an 11% average, depending on the level of ‘stress’ one wants to apply in their analysis. CLO managers need to align their strategies to maximize performance while observing market changes. Other factors, such as prevailing market conditions, could also impact this range. Based on our findings, we could rewrite the formula above as follows:
- Low Value: Losses Allocated to CLO Tranches = 86%* Total Portfolio Credit Losses
- High Value: Losses Allocated to CLO Tranches = 94%* Total Portfolio Credit Losses
- Average Loss: Losses Allocated to CLO Tranches = 89%* Total Portfolio Credit Losses
A review of the OC test
CLO market observers understand that a critical feature in CLOs is the benefit of excess interest generated by the underlying CLO portfolio to provide credit support for the CLO tranches. But the benefit of excess interest in reducing the EL for CLO tranches is highly dependent on several variables.
A critical structural feature in CLOs that helps ‘trap’ this excess interest to support the CLO tranches is the OC test (note that CLO structures will typically have several OC tests at various points in the waterfall – in this paper the singular term ‘OC Test’ refers to all OC Tests collectively).
With no OC Test, the benefit of excess interest will be limited because most of the excess interest will leak out to the equity investors – this would mirror to a certain extent the treatment of excess interest for a portfolio of loans on a bank’s balance sheet or an insurance company’s general account, where the income could be used for other purposes by those institutions and not trapped and secured for the benefit of the CLO noteholders.
OC tests are generally incorporated within the CLO cashflow waterfall. Upon a breach of such test, they are intended to divert available interest proceeds first, then principal proceeds if needed, to pay down the notes in order of priority until cured. Typically, there is a test for each class of notes except for the class that was initially the senior most. In that case, any proceeds diverted are at the expense of the equity including the relevant junior notes depending on which test is breached.
The OC test is usually calculated based on the ratio of the total par amount of the underlying portfolio (plus principal proceeds) over the outstanding amount of the relevant class of notes (including those that are senior to it). However, there are adjustments in the form of haircuts that are commonly applied to the portfolio.
These typically include those that are classified to be in default or purchased at a deep discount as well as the total amount of those rated Caa/CCC in excess of a predefined limit. CLO managers must meticulously monitor collateral quality to enhance the performance of CLOs. OC tests are more likely to be breached upon credit losses and/or excessive negative credit migration.
It is important to note however that the ultimate benefit of this feature can depend on many factors as CLOs are complex and the behavior of the economic environment is uncertain. Some examples of these factors include:
- Available excess interest (e.g., weighted average spread of underlying loans, cost of debt across the CLO notes, behavior of reference rates)
- Amortization profile, prepayments (i.e., introduces reinvestment risk)
- Timing of defaults (e.g., front loaded defaults may trigger tests earlier)
- ‘Tightness’ of OC test trigger levels (e.g., lower trigger levels may reduce effectiveness of tests)
- Portfolio manager trading behavior (e.g., can increase – or decrease – par amount of portfolio through substitutions particularly when an OC test is failing marginally)
Assessing the benefit of the OC tests – a simple analysis
We have just described the basic mechanics of how OC tests work and highlighted a few examples that can impact their benefit, several of which are quite uncertain and challenging to forecast. Therefore, we choose to control for most of those variables and start from a simple stylized CLO as the intention of our analysis is to demonstrate the economic benefit of excess interest.
The benefit from this form of potential credit enhancement can be explained as to the reduction of the underlying portfolio EL. The analysis will also include an examination of the sensitivity while changing several variables that are straightforward.
To begin, we created a stylized CLO by reviewing a sample of recent CLO structures. The objective of this step is simply to assess how much excess interest is generated in a CLO structure. However, it is safe to say that excess interest is a prerequisite for any CLO structure.
Although the amount of excess interest would change over time based on market conditions, we could generalize that a CLO structure would not be issued when market conditions do not offer sufficient excess interest. See Tables 1-3 for assumptions made for our hypothetical CLO.
As we had noted in previous research, the collateral quality test matrix, typically incorporated in CLOs, is a clear indicator of the benefit of excess interest – the EL of the CLO notes would not be expected to materially change even as the credit risk of the portfolio increases because of the reduction in losses resulting, for example and most commonly, from an increase in excess interest.
The Matrix Scenarios provided in Table 3 were calibrated so that the tranche ELs of our hypothetical CLO were relatively consistent in each of the designed scenarios. CLO matrices typically provide many more options than the modeled scenarios presented here.
The portfolio is assumed to be static, consisting entirely of floating rate first-lien senior secured loans. Recoveries are also assumed to be realized immediately upon a default.
Table 1: Hypothetical Capital Structure
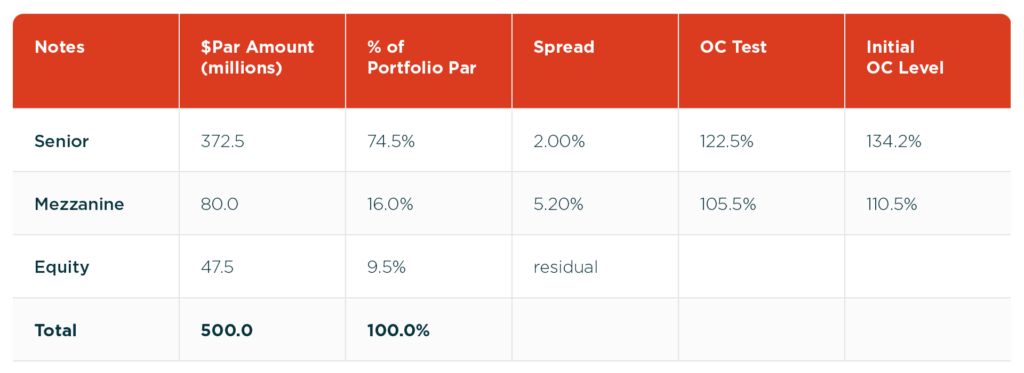
Table 2: Subset of Collateral Quality Tests
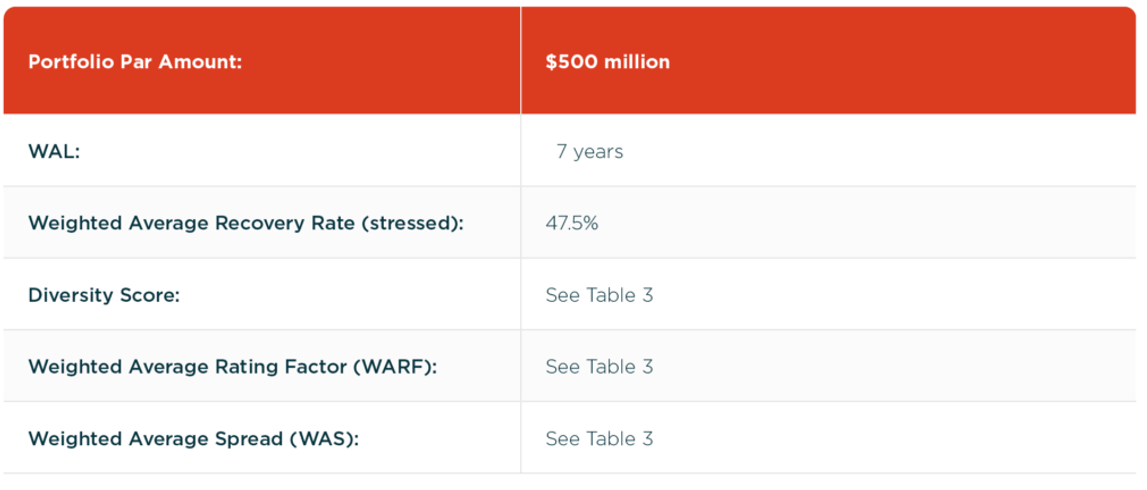
Table 3: Collateral Quality Test Matrix

With this stylized CLO, we assumed that the reference rate is 0%. This assumption allowed us to get a clearer picture of the excess spread that could be applied to reduce the portfolio EL. As reference rates rise, the amount of excess interest, depending on a given scenario of losses, can increase thus potentially offering greater credit enhancement.
For our analysis, we ran our model for each matrix scenario under a range of different stresses. We also ran various combinations of default rates, recovery rates and portfolio WAL for each of the matrix scenarios. The results of the various combinations are shown in Tables 4 and 5.
For each of the four matrix combinations, we ran the CLO cash flows assuming various levels of default rates (historical averages based on ‘idealized’ levels) and stressed default rates. We also ran two different recovery rate scenarios – again stressed and closer to historical averages.
We also ran two combinations of portfolio WAL. This broad range of assumptions allowed us to study the sensitivity of the excess interest in reducing portfolio EL. The column labeled ‘% Reduction of Portfolio EL – Note Paydowns Only’ represents the probability-weighted amount of interest proceeds that are diverted to pay down the notes, excluding any payments to the first-loss equity tranche. We believe that this number is a reasonable estimate of the portfolio EL reduction attributed to excess interest.
Table 4: Portfolio WAL of 7 years
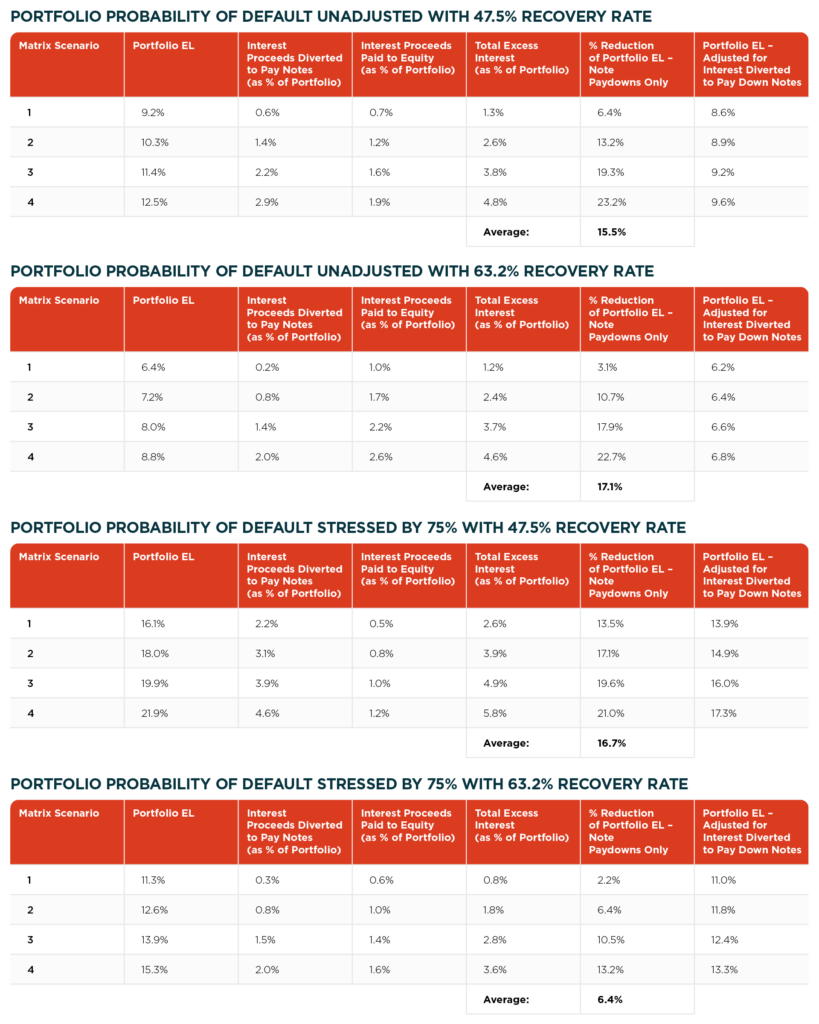
As we mentioned earlier, the collateral quality matrix offers the portfolio manager to choose amongst different combinations of portfolio characteristics (e.g., average rating, WAS, diversification) while maintaining the credit quality of the notes. In other words, and as we had noted in our previous research, the collateral quality matrix is the proof and our guide in trying to assess the reduction in portfolio EL resulting from excess interest.
In Table 4 we note that for the four different scenarios, the average reduction in Portfolio EL attributed to the excess interest ranges from 6.4% to 17.1%. As expected, the percent reduction of the portfolio EL increases as the portfolio EL increases within each set of matrix scenarios. Indeed, this result is also indicated by the percent of the total interest proceeds that is diverted to pay down the notes due to the OC test. In the matrix scenarios presented here, the ‘required’ WAS, an indicator of excess interest, of the portfolio increases as the average credit rating decreases.
It is also worthwhile noting that the proportion of excess interest that is distributed between the equity and what is diverted due to the OC Test over the life of a CLO is subject to uncertainty, some examples of which we highlighted earlier. However, it can be said that holding all else equal, a greater proportion would be expected to be diverted, the higher the OC trigger level. In which case, it would lead to a further enhancement against the portfolio EL.
Table 5: Portfolio WAL of 5 years
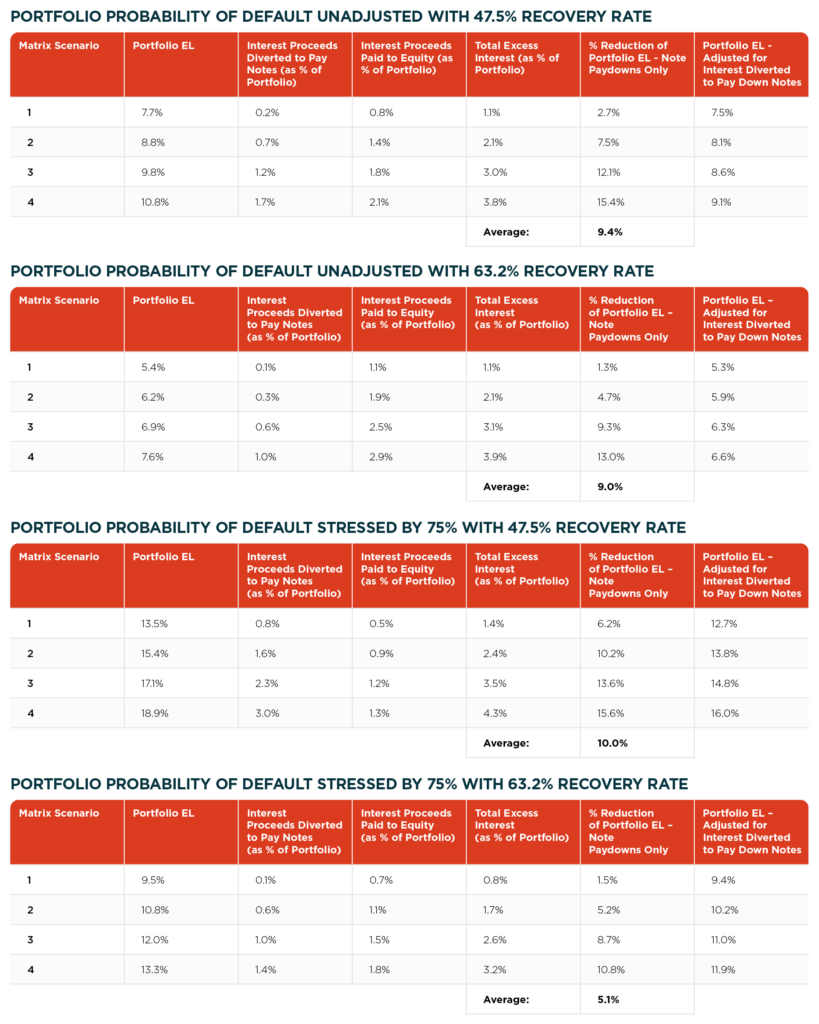
Comparing the results within Table 5 show a similar behavior to Table 4. However, when comparing the results between the two, notice that both the percent reduction to the EL and the percent of the total interest proceeds that are diverted are lower. This can generally be explained by a combination of lower portfolio ELs from lower probabilities of default and that the expected amount of available excess interest over the life of the CLO is lower, both due to the shorter duration of the portfolio. The range of portfolio EL reduction due to excess interest is 5.1%-10%.
Nonetheless, the results from the tables above are compelling in demonstrating the case that excess interest reduces the portfolio EL and provides our first estimate of the ‘Excess Interest’ in terms of reduction of the portfolio EL.
Based on the assumptions above, and for the broad range of different model inputs, we found that excess interest can reduce the portfolio EL in the range of approximately 6%-14% with an average portfolio EL reduction of about 11%. We derived this range by simply averaging and rounding the ranges of the two different tables.
We have also shown that it is quite challenging to derive a precise point estimate of the benefit of excess interest given the complexity of the analysis, the various assumptions that could be made and changing market conditions. As a result, we provide our views of a reasonable range of the benefit of excess interest in reducing portfolio losses. Essentially, we attempt to answer the following question:
‘What is the benefit from Excess Interest based on the formula below?’
Losses Allocated to CLO Tranches = Total Portfolio Credit Losses – Excess Interest
We believe that, based on our example, a reasonable range could be somewhere from 86% to 94% of the gross portfolio EL as compared to assuming no excess interest in the CLO.
A few notes
We have noted that our analysis included certain assumptions in order to demonstrate the impact of excess interest in reducing portfolio EL. Beyond the assumptions that have already been noted, other considerations that could impact our results include:
a. We assumed that none of the equity distributions reduce portfolio EL. This is a conservative assumption but given the complexity in trying to estimate the composition of equity distributions between interest and principal are beyond the scope of this paper. Either way, the equity tranche assumes the bulk of the portfolio EL anyway – as demonstrated in our previous research paper.
b. Our hypothetical CLO – see Tables 1-3 – was created based on relatively recent market conditions. Hence, the relatively large spreads on the notes (and to a certain extent, the portfolio). Under different market conditions, the results of our findings could be different. But generally, with narrower spreads on the notes, the benefit of excess interest increases and thus further reducing portfolio EL.
c. We used a limited number of matrix combinations. Using a broader and finer range of matrix combinations may show different results under different collateral quality test combinations.
Structural Dynamics of CLOs: Insights from OC Test Breaches
In this article, we have assessed and demonstrated the credit enhancing benefit of excess interest within CLOs as they typically incorporate a key structural feature, the OC test. In the event the OC test is breached, excess interest, which would have been distributed to equity, would be available to pay down the most senior note until cured.
Our analysis was based on several assumptions applied to a simple hypothetical CLO structure. Several scenarios were applied to observe the relative impact while changing several variables: the average credit quality of the portfolio, the available amount of excess interest over the life of the CLO, and the portfolio WAL.
The metric used to measure the relative benefit was based on the reduction in the EL of the underlying loan portfolio. As expected, we found that excess interest proceeds generated from the portfolio reduces the EL on the CLO tranches in all cases.
The results show an average reduction in portfolio EL of about 11%, though this amount is subject to a limited range of assumptions.
Although the results indicate that the impact can be sensitive, it is nonetheless clear and not surprising that this key feature of trapping excess interest, at a minimum, can provide additional credit enhancement.