
Summary
Private credit markets continue to be an important source of funding within the leveraged loan universe. This is especially the case for smaller to middle-sized companies, those with EBITDA of roughly $10mln-$250mln. Non-bank lenders have emerged as a growing source to funding to these borrowers through a variety of platforms.
Examples of these alternative investments include direct lenders, closed-end funds, to a lesser extent, collateralized loan obligations (CLOs), which generally fund larger and broadly syndicated loans (BSL), and last but not least, business development companies (BDCs). We have recently turned our analytical attention to BDCs as they provide both institutional and retail investors an opportunity to participate in the small and middle market lending asset class and as many are publicly traded.
Although BDCs typically invest in senior secured loans to smaller and middle-sized U.S. borrowers, the portfolio compositions can vary in many dimensions across BDCs, and in some cases quite significantly. Our analysis has highlighted key elements within the portfolios that would indicate the degree of correlation and hence effect the variance in the performance of a BDC’s returns (or losses) in two dimensions – issuers and industry.
These differences are particularly important for BDC investors (or lenders) as performance metrics would be further magnified due to the leverage that BDCs employ to finance themselves, similarly to CLOs, many closed-end funds and other leveraged investment vehicles. In essence, the relative risk/return profiles for these market participants can be more exposed to “fatter-tails” in the distribution of returns of the underlying portfolio due to less diversification (i.e., potential for greater volatility) – or conversely smoother and more predictable risk/return profiles due to greater diversification within the BDC.
Key performance drivers are related to the overall portfolio diversification of the BDC based on its concentrated exposure of investments made to unique borrower/issuers and industries/sectors, which are the focus of this paper, amongst other factors. We demonstrate through observations, which are based on publicly available information, that clearly indicate significant differences of diversification across BDC portfolios. However, this variation of portfolio composition also provides investors (or lenders) opportunities to better manage across the risk/return and portfolio diversification spectrums.
BDCs – brief overview
The US Congress initially established BDCs in the 1980s to offer an alternative source of funding to developing smaller and middle-sized companies. BDCs are generally subject to the same rules and regulations that apply to US regulated mutual funds – the Investment Company Act of 1940 and the Internal Revenue Code of 1986 for tax purposes.
BDCs are typically leveraged, subject to a maximum amount, with financing typically based on a combination of credit facilities and term debt. BDCs are subject to certain investment criteria (e.g., minimum percentage of investments consisting of smaller U.S. companies) and are required to pass through at least 90% of earned income.
The underlying portfolios typically comprise of first-lien senior secured loans to private corporate borrowers – other possible investment strategies may be around subordinated loans, mezzanine debt, special situations, and distressed debt, amongst others.
The investments are managed by asset managers with extensive expertise and operations capacity in this asset class where, in many cases, the manager may already participate outside of the BDC as direct lenders, private equity sponsors and/or manage other types of vehicles (e.g., CLOs, private accounts, closed-end funds).
In a previous analysis, we highlighted some key differences between private credit and BSL as well as factors for investors to consider. BDCs are generally substantially weighted towards middle market and smaller company lending although there are some BDCs with notable CLO/BSL exposure.
Those BDCs that are publicly traded not only offer liquidity to investors but also a great amount of transparency. For example, like other public companies, they are required to provide quarterly and annual reports. These reports make available to the public numerous detailed information related to the underlying portfolio and is the primary source of information our observations are based on.
It should be acknowledged that these are point-in-time snapshots of the portfolio and could change over time as BDCs are going concerns and actively managed. However, they do provide valuable insight into the manager’s lending/investment philosophy, and we believe our conclusions and findings are generally valid across time. Market participants should view this as an example of portfolio variation across the public BDC spectrum at a given point-in-time.
Comparing diversification across BDCs – key observations
We selected a sample of 32 BDCs to compare amongst the 40+ that are publicly traded (see Appendix). These examples were chosen to clearly demonstrate how the composition of the portfolios can vary significantly across BDCs. In this case, the focus is with respect to investment diversification as reflected by the distribution of borrower/issuer and industry/sector concentration levels. Other diversification benchmarks, which is outside the scope of this paper, could include investment strategy, credit risk, geography, currency, seniority of debt, asset class, level of affiliation, etc.
See Exhibits 1-4 below illustrating various concentration statistics followed by noteworthy observations. Note that the percentages and amounts of the respective portfolios are based on fair market value in USD as reported, in most cases as of the most recent calendar year-end. In addition, we excluded any investments that were in cash (or its equivalents) or had a fair market value of zero.
Borrower/issuer concentration
Exhibit 1: Top Seven Borrower/Issuer Concentrations vs. Average Concentration
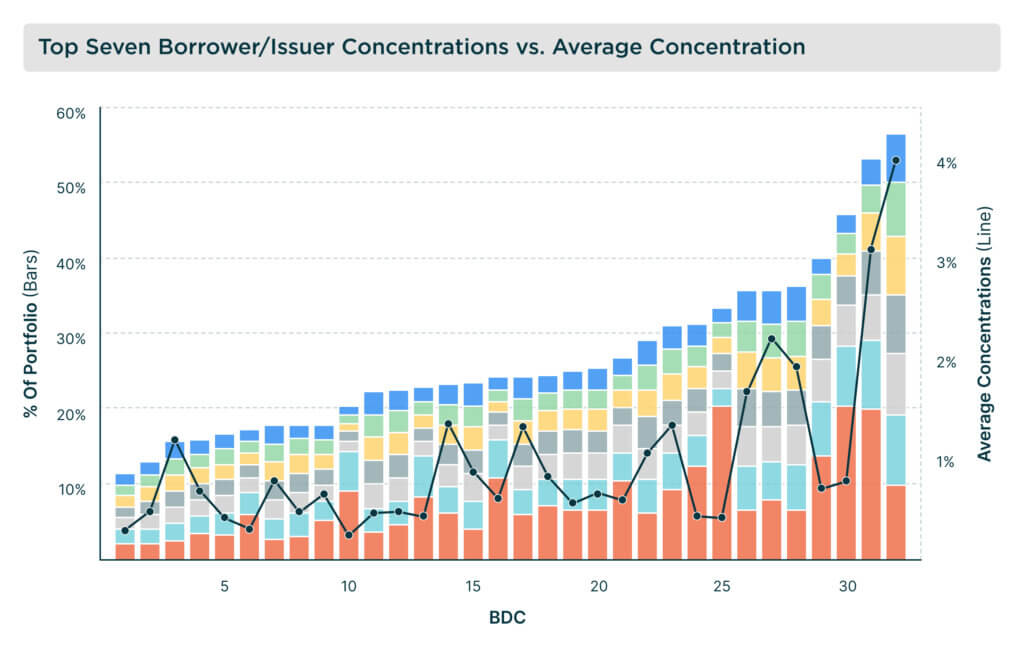
The distribution of credit and investment exposures to unique borrowers/issuers is perhaps the best indicator to begin an assessment of the level of portfolio diversification. A BDC manager may allocate several investments to a single borrower/issuer, for example, based on a combination of loans/debt and/or equity. As such, we combined all investments to a unique borrower/issuer for purposes of determining concentration. We noted that on average there were around 1.5 investments per unique issuer with ranges of close to 1 and a third of our sample in excess of 2.0.
In many instances, portfolios tend to be fairly concentrated within the largest few exposures, but relatively granular with the remainder. See Exhibit 1 above illustrating that the largest seven borrowers/issuers range from approximately 10% to about half of a given portfolio.
Also, BDC portfolios can consist of less than 30 investments allocated to unique borrowers/issuers to more than 300. The exhibit also illustrates the level of average borrower/issuer concentration in the portfolio that provides additional insight into the degree of granularity across the portfolio.
It is important to note that, in several BDCs, aside from significant exposures to general corporate borrowers, some of the largest investments are allocated to pools of investments (or ‘funds’). These funds can consist of an underlying portfolio of credits financing private corporate borrowers, real-estate, or equipment as examples.
They can be managed by the same manager of the BDC, a joint venture with the BDC manager, or another fund altogether (e.g., CLO, another BDC, closed-end fund). The latter would likely be managed by a separate entity.
In some cases, these funds can be around 10% or even greater than 20% of the BDC portfolio. Obviously, one can argue that these investment allocations indicate more diversification than one made to a single corporate borrower.
However, the degree of diversification would depend on exactly what investments underly the fund and its individual exposures versus the rest of the BDC portfolio (e.g., borrower overlap). In addition, for an investment in a fund that is levered, like a CLO, it would also depend on what seniority position the investment is within the capital structure (e.g., senior, mezzanine, equity).
Industry/sector concentration
Comparing industry/sector exposures across BDC portfolios is a bit of a challenge since there is no standardized industry reporting classification taxonomy used across the BDC market. Some BDCs classify industries more broadly across their investments while others classify them on a more granular level.
To further complicate matters, as mentioned earlier, certain BDCs have investments that are in funds. It is more difficult to determine industry concentrations in those cases unless one can look through to the underlying investments within those portfolios. For example, it may be unlikely that a CLO portfolio has any significant borrower overlap with the rest of the BDC portfolio since they typically comprise of BSL and that they are often managed independently.
However, this may not necessarily be the case with respect to industries/sectors. In which case, market participants would need to rely on their own assessment based on information made available. Nonetheless, determining diversification across funds or CLO portfolios within a BDC portfolio is beyond the scope of this paper as it can depend on many factors (comparable to those presented here).
Therefore, to make the BDCs more comparable in this respect, with judgement, we mapped the industry classifications that each BDC reported for each investment to a standard group of industry categories.
Exhibit 2: Top Three Industry/Sector Concentration vs. Average Concentration
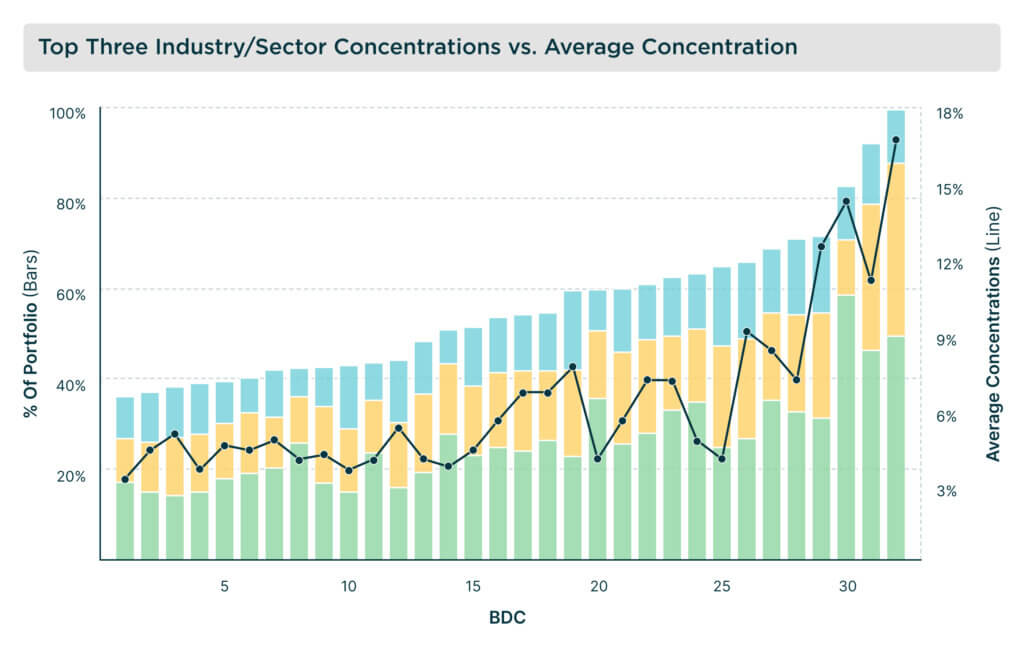
Initial observations indicate that BDC portfolios are generally concentrated amongst several industries. See Exhibit 2 above illustrating that the largest three exposures typically exceed 40% and in some cases exceed 70% of the overall portfolio. Additionally, the total number of industries represented across a portfolio range from less than 10 to more than 20.
Again, note our earlier comments as some of the top industry classifications may include investments in funds consisting of underlying portfolios. As with Exhibit 1, the exhibit also illustrates the level of average industry/sector concentration in the portfolio providing additional insight as to the granularity across the portfolio.
Exhibit 3: Common Industry/Sector Concentrations Across BDCs
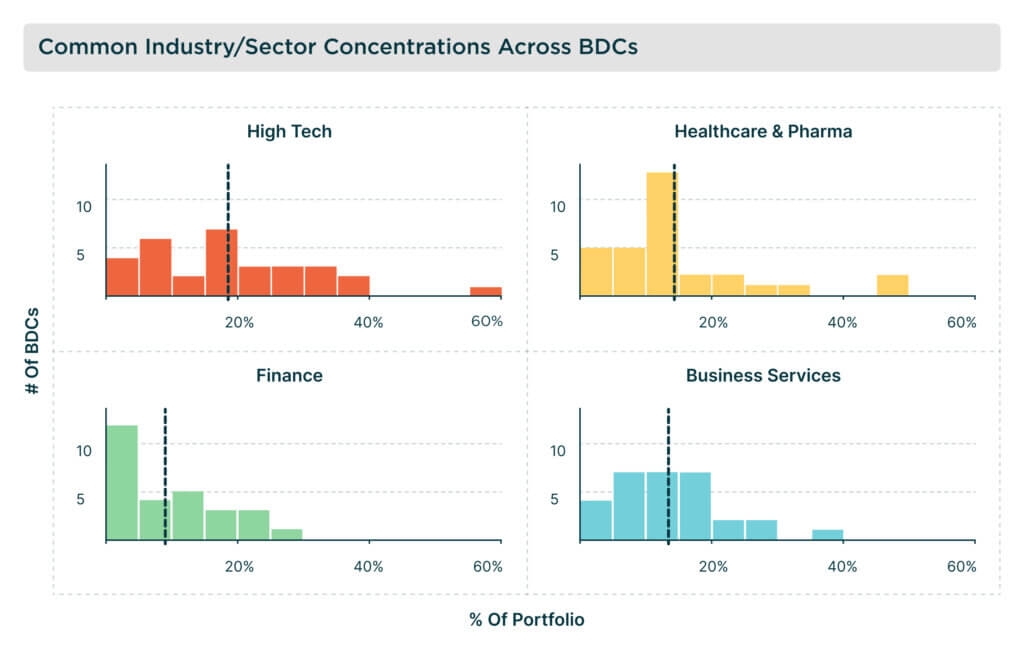
It is also noteworthy that several industries commonly appear across the BDCs (see Exhibit 3 above). Specifically, these industries are related to high-tech, healthcare & pharmaceuticals, business services, and finance. Furthermore, in many cases, these industries are within the top three most concentrated (see Exhibit 2).
This is a particularly important factor for those investors (or lenders) that have exposures to a portfolio of BDCs when assessing the correlation across their investments as these industries represent some of the largest investments across the universe of BDC portfolios, in terms of both the number of individual investments and fair market value.
Of note, however, these industries could be diversified in their own right into finer industries that would imply lower correlation – for example, within ‘high-tech’ there are companies that focus on educational software, construction technology, cyber, electronics, green technology, health-tech, manufacturing technology, etc.
Not surprisingly, however, the most concentrated BDC portfolios can be less correlated with others since they may have minimal exposure to (or exclude) many industries. This is obviously another key factor for those market participants that allocate (or monitor) investments across BDCs as it can provide an opportunity for additional diversification and/or targeted allocations to certain industries in the private markets.
Asset type/seniority concentration
While we won’t delve into detail for this article, but may be explored further in future Alter Domus research, it is worthwhile noting that the type of and/or seniority level of the investments can vary across BDCs. See Exhibit 4 below for concentration levels across various asset classes as reported by the BDC. We grouped certain types together as they can be considered as other and with relatively small exposures with the exception of CLOs (particularly the most subordinated), which can be significant.
Exhibit 4: Asset type/seniority concentration
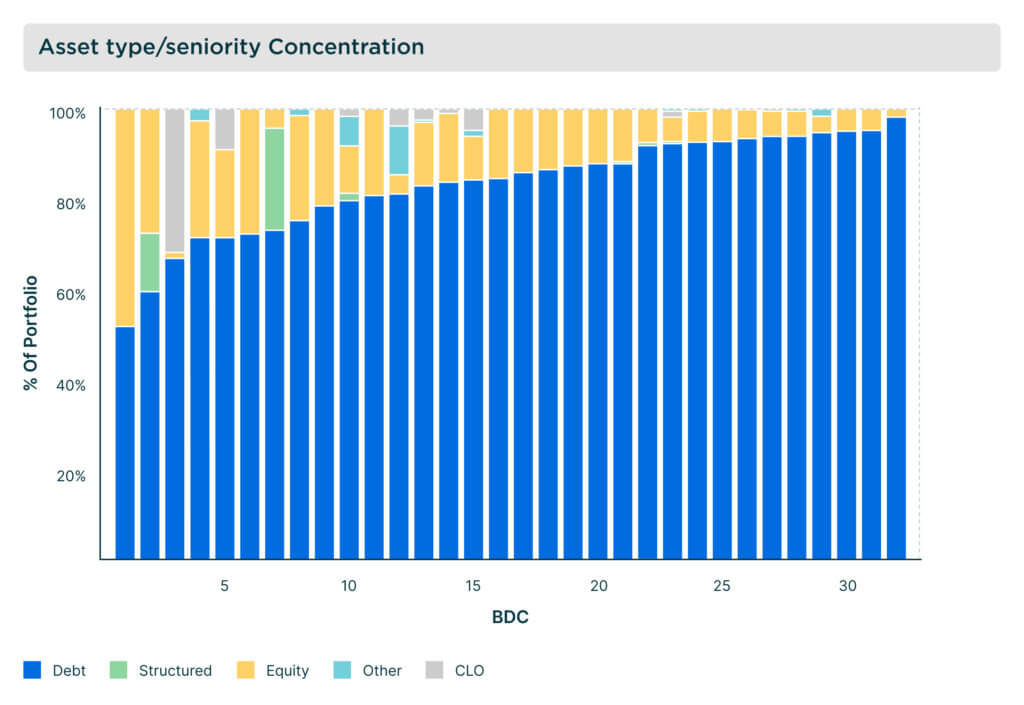
Exhibit 4 shows that debt is commonly the most significant portion of the portfolios. This is to be expected as BDCs typically extend credit to corporate borrowers usually in the form of senior secured loans. Within the debt spectrum, these can vary from senior secured loans that are on a first or second-lien basis to those that are unsecured or in the form of notes.
As mentioned earlier, BDCs can offer financing to a single borrower across the capital structure (e.g., senior secured, mezzanine, equity) depending on the BDC manager’s financing strategy. The combination may explain some of the significant equity exposure. The equity exposure can be an investment in a levered fund as well.
Conclusion
Non-bank lenders, within the private credit market, have been an important alternative source of loan funding for smaller to middle-sized U.S. companies through various platforms (e.g., direct lenders, closed-end funds, BDCs). BDCs are particularly worthy of attention since they offer a spectrum of investors an opportunity to participate in this lending asset class and as many are publicly traded.
Portfolio compositions can vary quite significantly across BDCs even though BDCs typically consist of leveraged senior secured loans extended to smaller and middle-sized U.S. borrowers. These differences across BDCs offer investors a menu of risk/return profiles to suit their needs.
We presented our observations on variations in diversification across BDC portfolios based on an evaluation of elements that are key indicators to the overall level of diversification, with an emphasis on concentrations to unique borrower/issuers and industries/sectors.
In conclusion, our analysis indicates significant differences of diversification across BDC portfolios, which provides investors opportunities to better manage across the risk/return and portfolio diversification spectrums.
Appendix: List of BDCs
| BDC Name | Trading Symbol |
| Ares Capital Corp | ARCC |
| FS KKR Capital Corp | FSK |
| Blue Owl Capital Corp | OBDC |
| Blackstone Secured Lending Fund | BXSL |
| Prospect Capital Corp | PSEC |
| Golub Capital BDC, Inc | HTGC |
| Main Street Capital Corp | MAIN |
| Hercules Capital Inc | HTGC |
| Sixth Street Specialty Lending | TSLX |
| Oaktree Specialty Lending | OCSL |
| Barings BDC, Inc | BBDC |
| MidCap Financial Investment Corp | MFIC |
| Bain Capital Specialty Finance, Inc | BCSF |
| SLR Investment Corp. | SLRC |
| CION Investment Corp | CION |
| BlackRock TCP Capital Corp. | TCPC |
| Crescent Capital BDC Inc. | CCAP |
| PennantPark Investment Corp. | PNNT |
| PennantPark Floating Rate | PFLT |
| Trinity Capital Inc | TRIN |
| Capital Southwest Corporation | CSWC |
| Fidus Investment Corp | FDUS |
| Stellus Capital Investment Corp | SCM |
| Saratoga Investment Corp | SAR |
| Gladstone Investment Corp | GAIN |
| Horizon Technology Finance Corp | HRZN |
| Portman Ridge Finance Corp | PTMN |
| Monroe Capital | MRCC |
| Oxford Square Capital Corp | QXSQ |
| Great Elm Capital Corp | GECC |
| Loan Ridge Finance Corp | LRCF |
| PhenixFin Corporation | PFX |