
In the dynamic world of alternative investments, Broadly Syndicated Loans (‘BSL’) continue to be an important part of the market. The Leveraged Loans market as a whole yielded a near record 12% return this year. And CLOs are expected to continue to have high issuance in 2024, with most banks forecasting between 100 and 115 billion in new issuance this year, numbers quite similar to last year’s high level of issuance.
Amidst today’s high interest rates, it’s no surprise that the BSL market has become and continues to be a popular choice for investors seeking attractive yields and a relatively low risk profile. We’ve previously written about BSL characteristics, loss protecting features, and prepayments. We now additionally consider macroeconomic factors that drive prepayments.
As the market grows in importance, investors are increasingly asking how BSLs might perform under a range of macroeconomic conditions. While some discussion has gone into monitoring default risk via stress tests, most stress testing is primarily focused on default risk and instead opts to zero out prepayments as a conservative assumption.
While this creates simplicity, it runs the risk of creating excessively conservative and unrealistic stress tests. This simplicity ignores an important fundamental concept in credit risk – the Exposure At Default (‘EAD’). EAD is a critical component of credit risk – in addition to probability of default (‘PD’) and loss-given-default (‘LGD’).
Using our Risk Modeler Analytics platform, we can adopt a more prudent approach to stress testing that considers both default risks and prepayment risks and ensures that EAD is addressed. Prepayment analysis is also generally critical for BSL investors for proper cash management, including investor redemptions and reinvestment strategies.
In our previous article, we discussed the benefits of forecasting prepayments and looked at a broad set of factors that can predict prepayment rates. However, we did not consider macroeconomic factors, which raises the question: Why might someone want to focus heavily on macroeconomic factors when forecasting prepayments?
Firstly, aggregate prepayments vary wildly across time, ranging from 3% to 12% on a quarterly basis in our sample portfolio. Secondly, these prepayments correlate strongly with macroeconomic factors in ways that are consistent with sound economic reasoning, suggesting that the correlations will hold in future scenarios.
Finally, this opens up the door to incorporating scenario-based thinking and stress testing as a means of driving analysis and decision-making. An important note to consider is that scenario analysis need not necessarily be only regarding stress scenarios.
Given the novel combination of interest rates and inflation in the current macroeconomic environment, numerous different positive scenarios can be constructed with different implications for prepayments. Considering such scenarios is increasingly important for sophisticated BSL managers attempting to do cash flow management.
Modeling approach
As part of our process, we selected a sample of loans from our BSL universe and attempted to model prepayments primarily using macroeconomic factors. We used two broad approaches to create our models, incorporating insights commonly observed in loan agency practices to better understand borrower behavior and repayment trends.
The first approach, called the holistic approach, focuses on a wide range of macroeconomic factors. This approach allows users to potentially consider scenarios based on variations of any of these variables. For example, one might consider a high inflation/low-interest rate scenario, a high GDP/high inflation scenario, or any other combination.
The second approach, called the targeted approach, focuses on a single specific variable along with its lags. This has the advantage of creating a parsimonious model, which is easier to understand and implement.
Holistic Model
The holistic model attempts to capture the macroeconomic factors that could affect loan prepayment speed. Inflationary pressure, macroeconomic outlook, and the interest rate environment are some of the macroeconomic factors that are generally expected to be relevant to BSL prepayments.
With this idea in mind, we assembled a large set of macroeconomic factors and tested them in combination with each other. Instead of testing all combinations of all transformations of the relevant variable pool, we tested combinations of the most important variables and avoided trying too many different transformations and combinations. The result is a model that includes several variables that are intuitive and logical.
The following variables are included in the model, along with an explanation of the economic reasoning for having them:
- CPI (quarterly growth) –This variable captures the current quarter’s inflation rate. As such, it tells us about the current inflationary environment and provides a decent proxy for inflation expectations moving forward. Borrowers facing higher inflation expectations will be more inclined to find alternatives to prepayment (i.e. reinvesting in the business) and thus prepayments would be expected to decrease, all else equal.
- S&P 500 (year-over-year growth) – As public equities markets are forward looking indicators of macroeconomic growth, the change in S&P valuations gives us a good indicator of how markets feel about macroeconomic prospects. When the S&P is improving, prepayments increase reflecting the fact that borrowers likely feel enough optimism to attempt to pay off more of their debts and/or raise equity financing to prepay debt.
- High Yield Index Option-Adjusted Spread – The spread considered looks at yields of corporates with ratings of BB or less with respect to a spot Treasury curve. The index has a negative relationship with prepayments, all else equal. When spreads decrease, borrowers are less inclined to hold loans still tied to a higher spread from a previous high spread period. As such, they’re likely to prepay knowing that they have the option to get new financing under a more favorable spread.
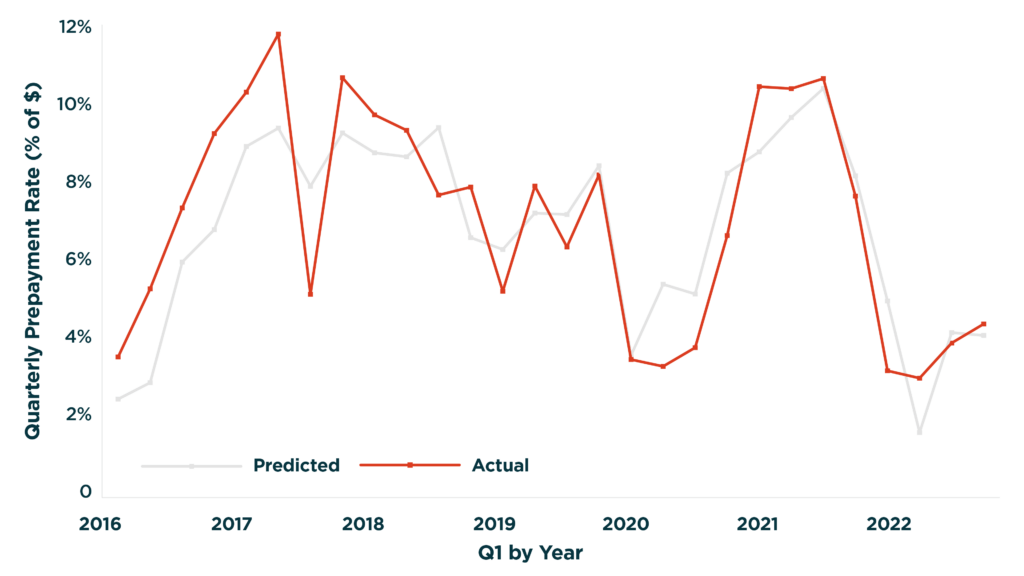
In Exhibit 1 below, we see the model fit through historic data. In the earlier parts of the data, the sample of loans is not yet fully populated and consequently a bit more volatile from period to period. As such, the fit isn’t as strong. But from 2018 forwards, the model-fit is quite good and we can see that the model captures the major swings in prepayments that have occurred in response to the significant macroeconomic shifts that have occurred since 2018.
Exhibit 1: Macro Model Fit
Targeted Model
While the holistic model captures a good deal of nuance regarding the various factors that could drive prepayment risk, the complexity creates some costs. Coefficients become harder to interpret as more variables enter the model.
Creating logically consistent alternative scenarios becomes harder as more variables must remain consistent with each other. As an alternative one could consider a simpler model that focuses on just one variable along with its lags. Fortunately, when one looks at the High Yield Option-Adjusted Spread, one finds such a variable.
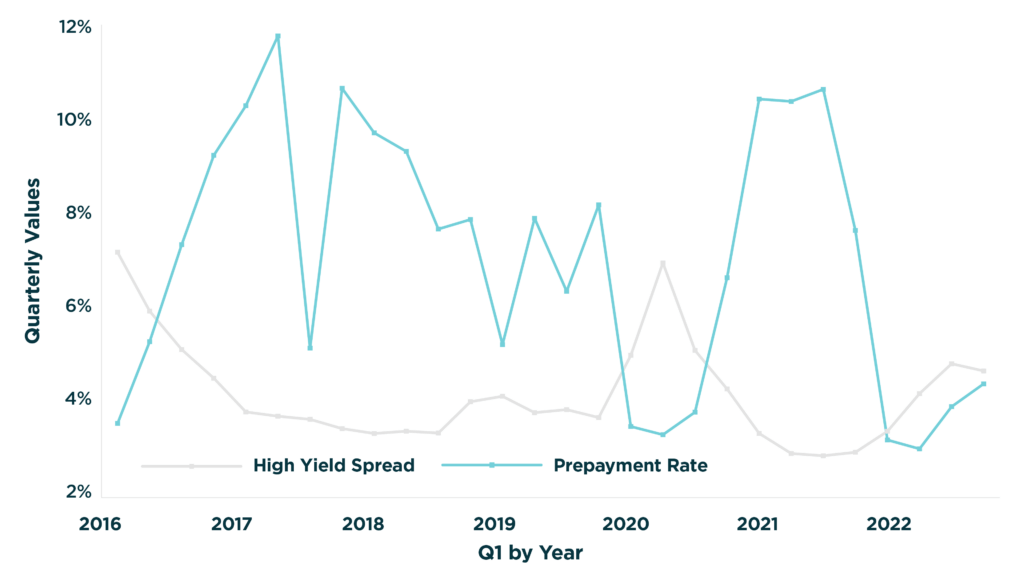
Simply plotting the two variables against each shows a strong inverse relationship between spreads and prepayments. There’s also a straightforward and logical explanation. When spreads are lower, borrowers prefer to prepay and take advantage of lower spreads for refinancing. When spreads are higher, borrowers do not.
Exhibit 2: Spread vs Prepayment Rate
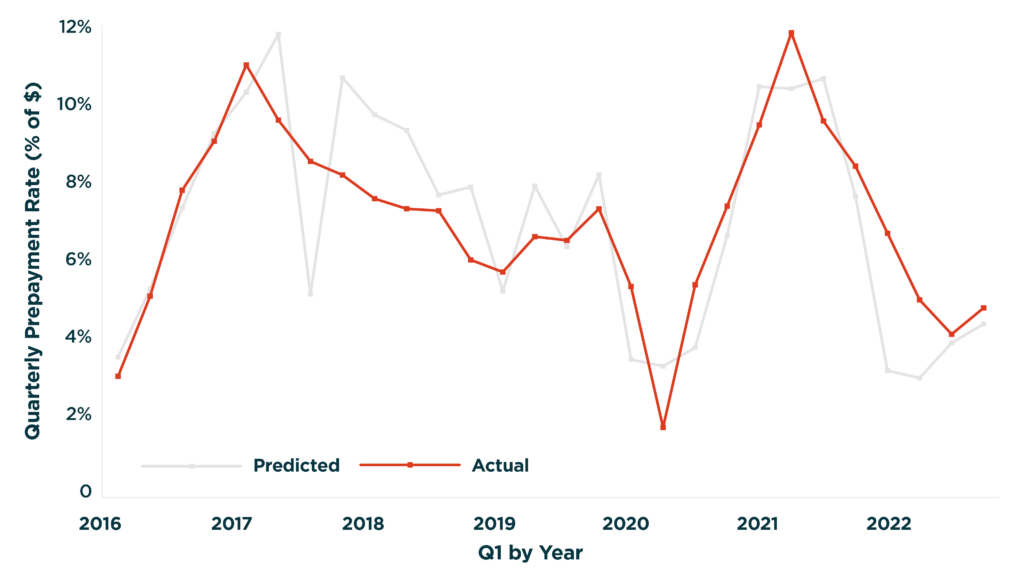
We can also consider lagged values of yield data, which points to an inverse relationship between spreads and prepayments. Lagged values are positively correlated with present prepayments. This can be explained by seeing current and previous spreads as both playing a role in driving prepayments.
If today’s spreads are low, but 6 months ago spreads were also low, then prepayments might not be as high as in an alternative situation where today’s spreads are low but 6 months ago spreads were extremely high. In the first case, borrowers likely took advantage of low spreads, but in the latter case, borrowers likely have high spread loans that they would be eager to refinance.
Exhibit 3: Target Model Fit
Scenario Analysis
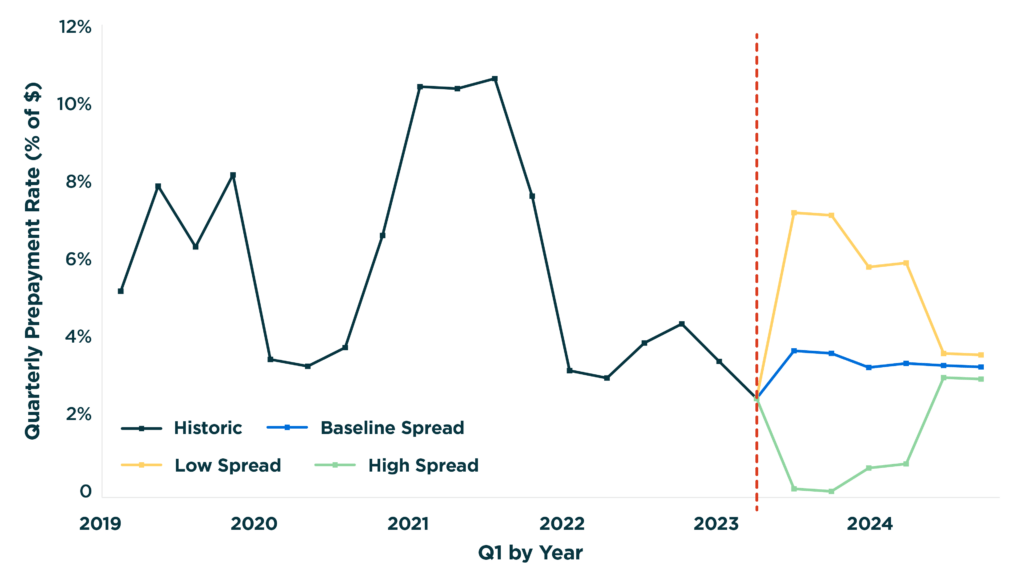
Creating forecasts across scenarios is necessary for doing scenario analysis. To do so, we start with a simple baseline forecast for High Yield Spreads, that shows it steadily decreasing over the near term. For alternative scenarios, we simply take the forecast and bump them up and down by 2 standard deviations of the series’ historic values. With that straightforward scenario prepared, we can create prepayment forecasts for our portfolio to see the impacts of changing spreads.
We can see the results below in Exhibit 4. Higher spreads lead to lower prepayments, lower spreads lead to an increase in prepayments. Interestingly, because we use previous values of spreads in the model, the model inherently recovers towards the baseline. This makes sense intuitively. If spreads drop, borrowers would prepay and refinance to take advantage of new lower spreads.
But if spreads remain at that level, borrowers will eventually no longer need to keep refinancing. By the converse, when spreads rise that may initially create difficulty for prepaying, but as borrowers adjust to the higher spread environment, they may find themselves reverting to their more typical prepayment behavior.
Exhibit 4: Scenario Forecast
Out-of-sample Results
These models were developed in early 2023 with data only being available through 2022Q4. At the time of writing, both prepayment and macroeconomic data were available through 2023Q3, allowing us to evaluate the accuracy of our forecasts by comparing them to the actual data.
The results showed a notable divergence between forecasts and actuals for both models with the actual data remaining at very low levels while the forecasts increased. In the holistic model, the lowered spreads, reduced inflation rate, and S&P 500 gains all drive predictions upwards.
In the targeted model, we witnessed spreads increase in 2022, followed by a decrease in 2023. According to the model, that combination will lead to increasing prepayment rates.
To explain this divergence, we can consider the possibility that pessimistic expectations about the future state of the macroeconomy led borrowers to avoid prepayment. The series of bank failures in March 2023 led to serious concerns of a potential wider banking and economic crisis.
Beyond that, the continued interest rate hikes led to widespread concerns that the effort to beat back inflation might cause a recession. The volatile geopolitical environment further exacerbated these effects to increase market volatility and stress market sentiment. With these different perceived risks to the macroeconomy, borrowers would likely hesitate about prepaying even if the current macroeconomic data showed signs of improvement.
We can see evidence of forward-looking pessimism in a number of data sources. According to NABE, a majority of Economists surveyed in February 2023, expected a recession in the next 12 months. Furthermore, consumers showed similar pessimism regarding the future.
Within the Consumer Confidence Index, the Present Situation Index and Expectations Index diverged in recent data. The Present Situation Index recovered substantially in 2021 and has remained at a high level. Whereas expectations began dropping in 2022 and have recovered only slightly since then. However, to fully understand the impact of these perceptions on prepayment behavior, it’s important to examine business perceptions as well. After all, businesses are the actual borrowers in this context.
The OECD’s Business Confidence Index shows a similar pattern. Business Confidence peaks in early 2022 as it recovers from the COVID pandemic, but then begins declining from there. In early 2023, it bottoms out close to its pre-COVID level and remains at that low level.
Another frequently discussed forward looking indicator for recessions is the 10-year 2-year Treasury Spread. The indicator has predicted every recession between 1955 and 2018. The yield curve has been negative since July 2022, suggesting that markets are expecting a downturn in the new future.
Having considered an explanation for the forecast divergence, one can consider modifying the model to improve its performance going forward. Given the popularity of the 10-year 2-year Treasury spread as an indicator of recessions, we can consider using that in the model.
We take the holistic model consisting of S&P 500 growth, High Yield Spreads, and CPI growth. Both the S&P 500 growth rate and the 10-year 2-year spread are capturing future expectations of performance. So, we can try substituting the S&P 500 growth rate with the 10-year 2-year Treasury Spread.
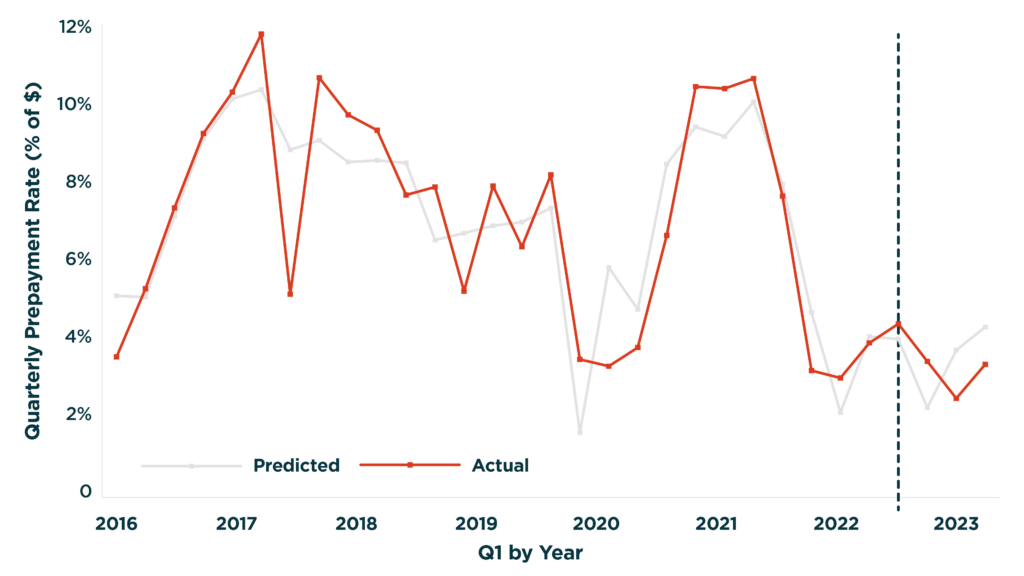
When we evaluate the new model, we find that it does better in back-testing exercise for 2023 (as see in Exhibit 5), as well as in a rolling back-test exercise where we consider each of the previous years as potential holdout samples. Given that, the revised model seems to do better forecasting both history and recent data, we can consider using it as a champion model going forward.
Exhibit 5: Out-of-sample results for Revised Model
Conclusion
In this article, we have explored how macroeconomic factors drive prepayment risk in the BSL market and the importance of stress testing and scenario analysis in making informed investment decisions. Through our Risk Modeler Analytics platform, we presented two approaches for thinking about macroeconomic factors: 1) a more sophisticated approach that considers numerous macroeconomic factors and 2) a more straightforward approach that is easier to implement for scenario analysis.
We then reviewed the out-of-sample results and recent macroeconomic data. We found that incorporating 10-year 2-year Treasury Spreads as a factor in the model could improve the model’s out-of-sample forecasting results and have added that into a new model moving forward.
In conclusion, understanding how macroeconomic factors affect prepayment risk is crucial in evaluating BSL investments. By utilizing scenario analysis and macro-based models, investors can gain insights into borrower behavior and make informed decisions that drive analysis and decision-making to allow BSL managers to manage their portfolios and optimize their returns.
Fortunately, a holistic model that incorporates inflation, 10-2 Treasury Yield Spread, and high yield spread variables offers a powerful, intuitive, and effective model input to facilitate this important prepayment analysis. These insights can also inform loan services that support modeling and monitoring needs. Stay tuned for the next prepayment analysis of loans issued by public capital market participants and retail lenders.