
Portfolio optimization is a cornerstone of modern asset management, aiming to balance risk/return, promote portfolio diversification, and improve overall portfolio efficiency.
Fixed income managers actively seek to optimize their portfolio allocations such that the portfolio is expected to generate the maximum return with the least amount of risk. In this context, managers may apply an internal scoring methodology to grade assets as part of their investment decisions. These scoring methods in many cases rely on a weighted approach based on certain factors, many of which may be subjective. In addition, managers may rely significantly on a single guiding metric, such as yield, but still need to further control for other factors, such as credit risk, to be comparable.
Investment decisions are further complicated by various constraints. Constraints may be market driven, such as the availability of investments or market prices. Investor-mandated factors such as average credit quality, percentage limitations and duration may also come into play, as do regulatory factors, such as SEC, NAIC, Federal Reserve, Basel III rules.
These constraints can apply across all areas in fixed income, whether the asset is an investment grade credit, a high-yield bond, a broadly syndicated loan, private debt or structured credit. Constraints could also extend to other ‘cash flow intensive’ investments, such as commercial real estate and infrastructure.
Given the myriad factors that investors must consider, it comes as no surprise that portfolio optimization in fixed income is a sophisticated process with complex methods and techniques.
In this paper we present a framework designed to address these complex portfolio allocation challenges. This framework offers a single universal metric, the Alter Domus Score (‘ADS’), which can arm managers with a solution for efficiently measuring an optimal portfolio allocation that is objective and comparable across any fixed income investment.
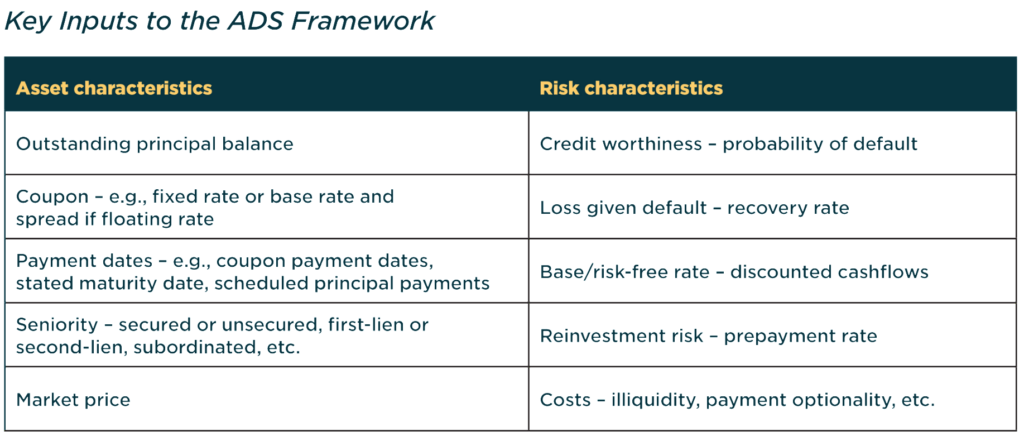
The ADS, which is an asset-based measure, is also robust and controls for information relevant to any fixed income investment – including those tied to asset based loans – ranging from cashflow characteristics and credit worthiness to market price, pre-payment, and illiquidity costs.
We will detail the elements of the ADS, including the underlying framework, and illustrate the relationship between the ADS and changes to certain key asset-based characteristics.
Why Trade Optimization?
Trade optimization addresses a fundamental economic problem: maximizing the efficient and productive use of limited resources, specifically investable capital. Fixed income managers must, therefore, choose from among various investment opportunities to maximize the overall portfolio return given each investment’s attributes, which include cashflows, credit risk, and market price.
In most cases, managers are also faced with a variety of constraints, such as credit quality, maturity, and diversification limits, to name but a few, which adds more complexity to their decision-making process.
Essentially, managers aim to navigate these variables to deliver the best value for their investments.
The ADS presents a framework that relies on a single metric and objectively accounts for economic factors that are key to any fixed income investment. This framework is particularly valuable for managers bound by constraints, helping them to make the best investment allocations when weighing tradeoffs. The ADS serves as a complement and support to existing methods used by investment managers.
The ADS: an objective and universal measure for trade optimization
The ADS is an objective measure that is rooted in fixed income theory.
Essentially, it represents the discounted and risk-adjusted cashflows for any expected stream of cash flows, including fixed income instruments, such as bonds, loans, and asset-backed securities (ABS).
The ADS is easily comparable across all securities since it is a measure based on a single dollar (or any currency) value at risk. This feature allows any prospective universe of fixed income investments to be rank ordered on a pro-forma basis to determine an optimal portfolio allocation that is subject to constraints.
The score means that a fixed income investor can compare a bond to a loan or an ABS security – or even a real estate investment – when selecting the optimal portfolio allocation investment decision.
The score is agnostic as to the type of underlying investment and relies on the individual cashflow characteristics of the asset, factoring in the time value of the expected cash flow and uncertainties due primarily to the credit risk of the borrower and potential prepayments.
Digging into the detail: the formula behind the ADS
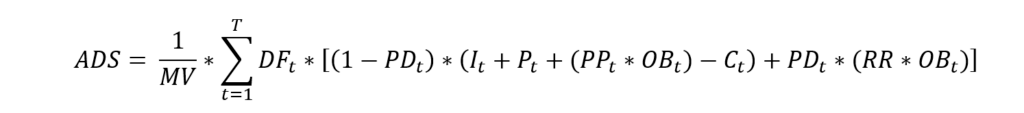
The ADS is calculated based on the following formula (see Appendix for detailed description of inputs).
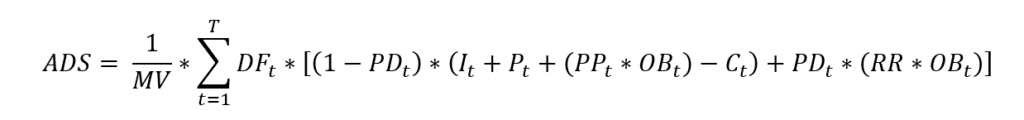
To make effective comparisons across assets, the outstanding principal balance of the asset is first normalized to an indexed value of 1, which results in the market value (MV) to be a percentage of the indexed value. Therefore, we can break down the key inputs into two groups – one group is based on asset-specific attributes and the other reflects cashflow uncertainties.
To present it simply, the numerator represents the present value of the risk-adjusted weighted cashflows over the duration of the asset, the Cashflows Risk-Adjusted Value (C-RAV) while the denominator is the MV[1].
Some key factors to consider are that the risk related inputs can be based on the manager’s judgement or can be used to gather insight as to what the market value implies.
The ADS can also be used to generate trade ideas for making asset substitutions, when, for example, seeking a better relative-value opportunity, and thus can increase the likelihood that a portfolio will be better off or more optimal.
Applying the ADS in different scenarios
It is noteworthy to begin highlighting three possible scenarios of the ADS for any given security.
- ADS > 1 (i.e., C-RAV > MV),
- ADS < 1 (i.e., C-RAV < MV), and
- ADS = 1 (i.e., C-RAV = MV).
Example 1: In cases where the ADS score is greater than 1, the time-value adjusted and risk-adjusted cashflows based on the manager’s expectations is greater than what the market price is reflecting. The asset is therefore ‘undervalued’, as indicated by the asset’s risk/return profile.
These are assets that offer the manager favorable investment characteristics, as the value of the risk-adjusted cash flows is greater than the price to acquire those cash flows.
Example 2: In cases where the ADS is less than 1, the time-value adjusted and risk-adjusted cashflows based on the manager’s expectations is less than what the market price is reflecting. The asset is thus ‘overvalued’, as indicated by the asset’s risk/return profile.
The manager will seek to sell these assets since the proceeds from those sales would exceed the manager’s fundamental assessment of what those cash flows are worth.
Example 3: In cases where the ADS score is equal to 1, the time-value adjusted and risk-adjusted cashflows based on the manager’s expectations is equal to what the market price is reflecting. So, the asset is ‘fairly valued’, as indicated by the asset’s risk/return profile. These assets have market values consistent with the manager’s fundamental assessment, and the manager would therefore be indifferent to holding, buying, or selling these assets.
When working through these scenarios, it becomes clear that a manager can begin to utilize the ADS as a metric for comparing and effectively rank-ordering decisions across different types of fixed income assets.
The ADS can also be used as a tool to inform the manager as to what the risk-based inputs the market is implying. With these inputs on hand, the manager can better assess whether an asset’s market price is rich or cheap.
Manager judgement, of course, is an important element to calculating the ADS.
The ADS could be pre-populated with apparently objective inputs and additional manager overlay could significantly improve the quality of the ADS and its utility as a tool to support portfolio optimization.
Assessment of prepayment rates and credit risk inputs are informed by asset manager expertise and play a big role in calculating the ADS.
Dissecting the AD-Score
The tables below illustrate the relationship between the ADS and changes to certain key inputs holding all else equal. We have intentionally kept the analysis simple so that we could better illustrate the mechanics behind the score.
A more thorough analysis, inclusive of actual cash flow payment dates (we assume annual for our simple analysis), spot risk-free rates (we assume a flat risk-free curve), more dynamic prepayment rates, and other more precise inputs are considered as part of the ADS.
For simplicity we also assume the assets are floating rate senior secured loans, but set at a fixed rate, and have a narrow band of possible recovery rates. The probabilities of default (PDs) are based on the Moody’s idealized default rate table.
The Tables that follow illustrate how the ADS score may shift under different scenarios:
Table 1: Impact of Coupon Rates and Credit Risk Ratings to the ADS
The first part of the analysis (see Table 1) shows the calculated ADS for a group of six stylized loans. The loan coupons range between 5.50%-10.75% (4.50% risk-free rate and risk premiums between 1.00%-6.25%) and have current ratings in the Ba2-Caa1 range. The loans have six-year stated maturities (with 10% constant prepayment rate – CAP) and assumed recovery rates of 45%. Note that for further simplicity we assume the current market values are 100% (or equal to par), and that the stated coupons are such that the current ADS is 1.00 (or ‘fairly valued’ at par).
Table 1 also shows a range of possible ADS scores based on changes to credit risk ratings and coupons. It can also be viewed as changes in the manager’s opinion of credit risk (or PD) associated with the loan. Furthermore, the ADS values can reflect the manager’s opinion on its own fundamental assessment of the loan cashflows (or C-RAV), holding all else constant.
In other words, these ADS values can reflect the manager’s opinion on what the fair value (or price) should be as a percent of par and can be used to compare to what the market price is offering.
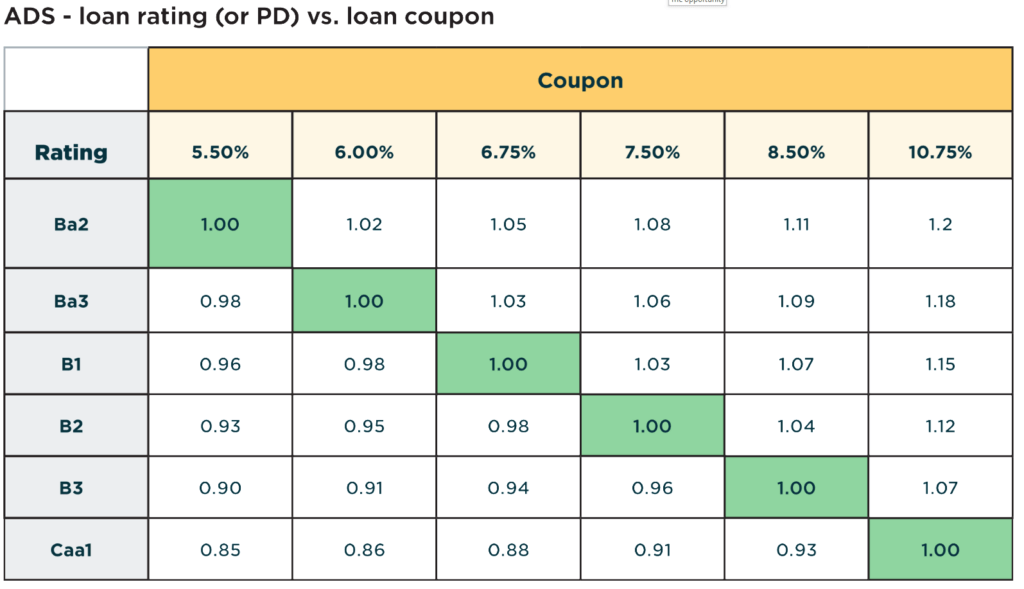
Initial noteworthy observations show that investors require compensation via higher coupons that are commensurate with lower rated loans, holding all else equal, such as a larger risk premium for riskier loans.
This can be reflected in the highlighted cells across the loans where the market price clears at par (also reflected with an ADS of 1.00). Notice that for each loan, a change to rating (or PD) impacts the ADS through C-RAV.
For example, if the stylized loan rated B2 were to be upgraded (or downgraded) by +/- 1 subcategory, the ADS value would change from 1.00 to 1.03 (and 0.96) respectively, assuming the market value of the loan remains pegged to 100%.
Table 2: Impact of Prepayment Rates to the ADS
Table 2 displays ADS values after reducing and increasing the CAP rate from 10% to 0% and 20%, respectively.
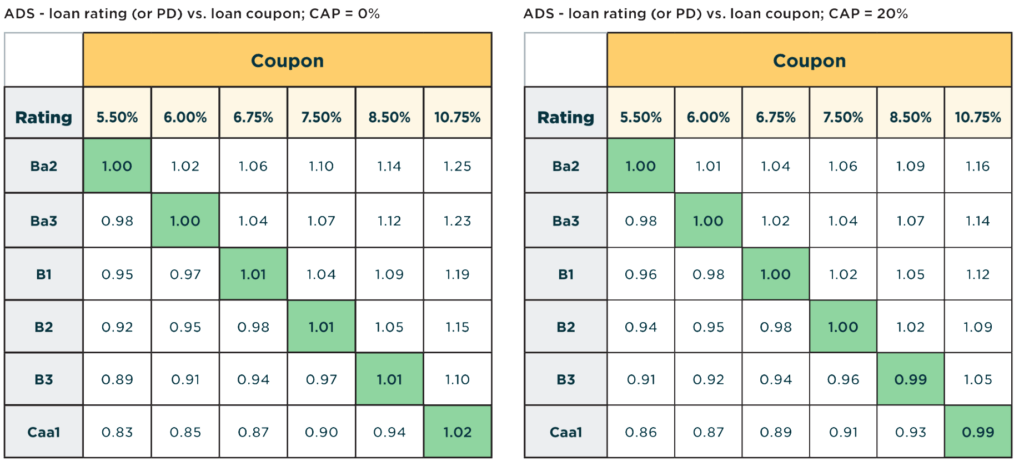
This scenario, of increasing prepayment rates, effectively reduces the asset’s weighted average life expectation, thereby reducing overall coupon cashflows, while also reducing the exposed amount to default, or in other words, prepayments are not subject to loss.
We first notice that those loans with lower ratings (and higher coupons) appear to be the most sensitive to CAP. A lower CAP rate scenario seems to generate more than enough coupon cashflows to compensate for the longer period of exposure to default, such as relatively higher C-RAV and ADS.
In contrast, the higher CAP rate scenario appears to reduce the coupon cashflows enough to lower the ADS (and C-RAV).
Keep in mind that this is an isolated scenario analysis meant for comparison. The outcome can be sensitive to other variable inputs, such as the default timing profile.
Table 3: Impact of Maturity to the ADS
Table 3 displays ADS values after reducing the stated maturity of the loans from 6 years to 5 and 4 years, respectively.
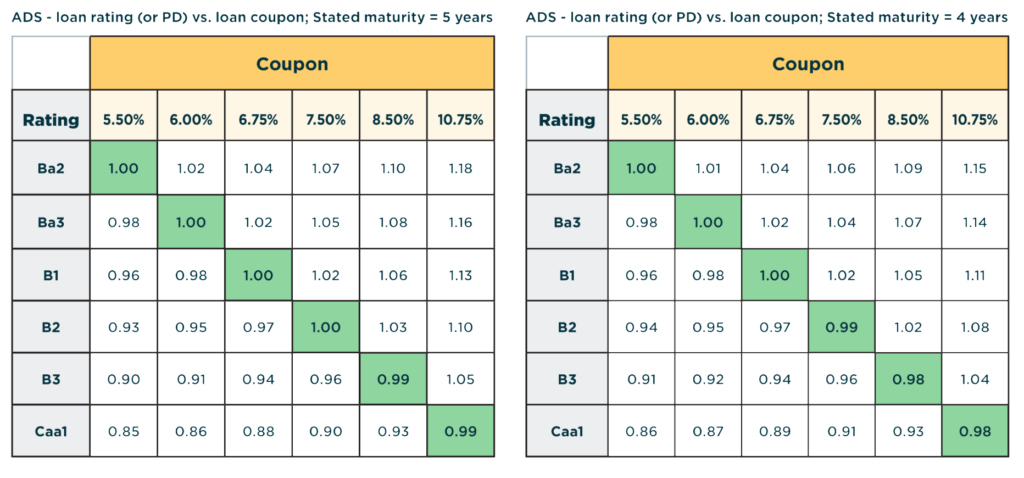
The stated maturity scenario analysis above shows that it has a similar effect to increasing the CAP rate (see Table 2) thereby drawing a similar conclusion.
Table 4: Impact of Recovery Rate to the ADS
Table 4 displays the sensitivity of ADS values at various recovery rates – from 40% to 50%.
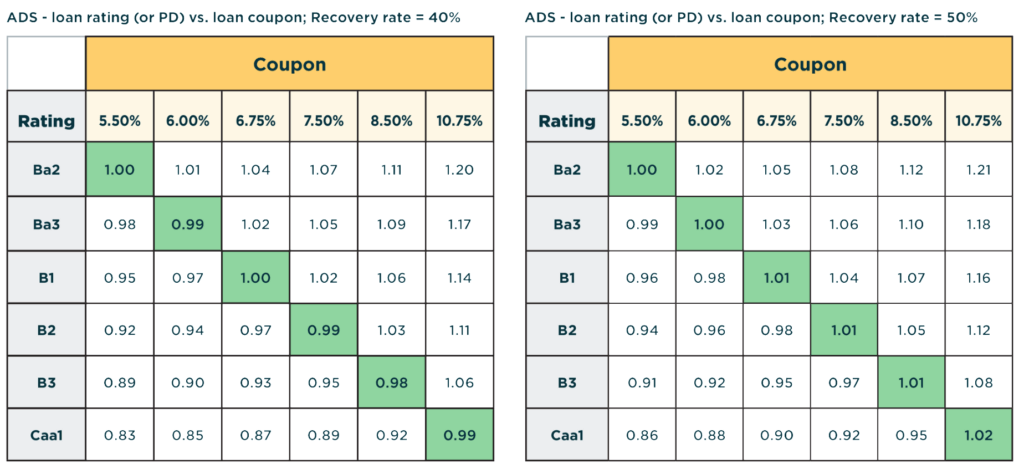
This scenario analysis impacts the ADS through the loss given default (LGD) expectation of the asset. The table results are clear and intuitive in demonstrating that as recovery rates increase (or, as LGD decreases), the ADS naturally increases.
The extent of the increase appears to be in the range of 1-3 points of incremental ADS as recovery rates increase by 10% (from 40% to 50%). The larger ADS impacts are reserved for the lower-rated, or riskier, assets since the benefit of the higher recovery rates is most pronounced when the probability of default is relatively high.
A tool to navigate the complexities of fixed income portfolio allocation
Fixed income portfolio managers seek to optimize their portfolios to achieve the maximum return with the least amount of risk. However, they face numerous challenges, including market-constraints, investor/lender mandates, and potential regulation.
As managers strive to optimize their portfolios, they often utilize a scoring approach for generating trade ideas. In this paper we presented a framework that can support decision-making for these types of complex portfolio allocation challenges and complement frameworks that may already be in place.
The framework provides a universal score, the ADS, that is easily comparable across all cash-generating assets. The ADS is also simple, robust and controls for critical information, whether it is objective or subjective, relevant to any fixed income investment.
For AD clients, including clients of Solvas and Enterprise Credit & Risk Analytics, the ADS is offered as an additional measure to support our clients with their trade optimization, portfolio allocation, and risk analytics.
Please contact [email protected] for further information on how to access the ADS.
Appendix: Calculation of the Alter Domus Score
The first step to compute the Alter Domus Score (ADS) for any fixed income instrument is to normalize the initial face amount to a value of 1 in the relevant currency. The ADS is then calculated as follows:
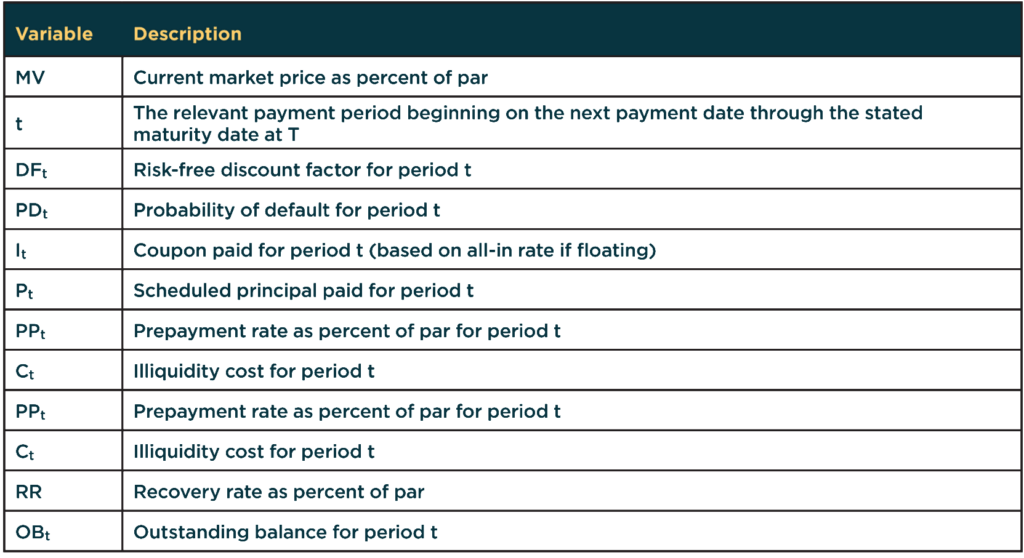
Where:
[1] The MV can be adjusted in cases where the manager is subject to certain trading criteria. For example, CLOs commonly carry any loan that was purchased below a certain threshold (or ‘deep-discount’) at the purchase price, which results in a haircut to par in the OC tests. The ADS would effectively be capped (potentially at 1) in this instance.