
Analysis
The Risks and Benefits of Business Development Companies (BDCs)
We evaluate the historical performance of BDCs to better understand how portfolio variation provides investors opportunities to better manage across the risk/return and portfolio diversification spectrums.

Our previous research has shown that there are significant differences of diversification across the portfolios of business development companies (BDCs).
This portfolio variation provides investors opportunities to better manage across the risk/return and portfolio diversification spectrums. In this paper, we evaluate the historical performance of BDCs to better understand this risk/return dynamic.
The selected sample of publicly traded BDC returns, which covers 2019-2023, includes a period of notable volatility. We also make use of broadly syndicated loan (BSL) returns covering the same period. Although we acknowledge that BSL have certain differentiating characteristics, BSLs could provide a reasonable reference that can add further insight into our analysis.
Our review shows that BDCs can offer investors an advantageous long-term risk/reward profile. The observed correlations presented for many of the BDCs within the index further reflects the benefits of variation in portfolio compositions across BDCs demonstrating that private credit, whether it is BDCs or BSLs, could provide additional diversification benefits to a fixed income portfolio.
It should be noted that the ongoing operational management of any BDC is also critical to BDC returns as is the more directly observable asset manager’s credit acumen.
Historical returns of BDCs and BSLs: Impact of market volatility and leverage adjustments (2019-2023)
The historical returns data in our study, which covers 2019-2023, includes two significant recent economic events. First, the onset of the global COVID pandemic, which led to a period of severely curbed economic activity followed by extraordinary fiscal and monetary stimulus to alleviate the economic impacts from the shutdowns.
Second, the accelerated pace of central banks tightening monetary policies to address the spike in inflationary pressures. The combination of disruptions to the usual supply chain channels and extraordinary stimulus is widely recognized as significant contributors to the market volatility during our period of study.
The returns are based on daily price and dividend distribution data for two publicly traded ETFs that track well-established public BDC and BSL indices. These indices provide transparent insight as to the relevant performance of their respective underlying asset class.
BDCs are reasonable proxies for private credit performance since the underlying assets of BDCs consist predominantly of senior secured loans to smaller and middle-sized corporate borrowers. The private credit markets have key features, as we have previously highlighted, that can mitigate risk while offering investors and borrowers a valuable investment and funding alternative.
| ETF | INDEX |
|---|---|
| VanEck BDC Income ETF (BIZD) | MVIS® US Business Development Companies Index |
| Invesco Senior Loan ETF (BKLN) | Morningstar LSTA US Leveraged Loan 100 Index |
The daily returns are used to compute total returns, relative volatility measures and the compounded annual growth rate (CAGR), which consists of the respective ETF price return and its dividend distributions.
The CAGR provides a proxy for the average annual total returns of the underlying investment portfolio performance as well as that of the respective ultimate underlying investment portfolios of those BDCs that comprise the index.
The dividends effectively represent the net investment income (NII) (i.e., net of management fees, expenses, and debt servicing costs) of the underlying portfolio as regulations stipulate that these funds (including the underlying BDCs) distribute at least 90% of earned investment income.
Note that BKLN and its underlying portfolio of BSL are unlevered. However, because BDCs operate with leverage against their portfolios, we take a simple approach to applying a leverage adjustment to the BKLN returns to make them more comparable.
The leverage adjustments applied to BKLN assumes the initial debt amount (and its service cost) used to finance the underlying BSL to be fixed during the entire period. We made assumptions of initial debt-to-equity ratios (DERs) that are between 1.0x to 1.75x, which is within the range of BDCs.
Note that under the Small Business Credit Availability Act passed by Congress in 2018, BDCs can elect to increase their DER to 2.0x (or decrease their asset coverage to 150%) subject to certain conditions.
The DER effectively magnifies the daily price returns while the assumed debt servicing cost implies an incremental excess yield (or NII) that is earned. This excess yield is based on the difference between the assumed (i) yield on the underlying investments and (ii) the debt servicing cost. Fees and expenses are already reflected in the underlying ETF returns.[1]
BDC vs BSL performance: Historical return analysis and insights
Table 1 displays the historical return statistics for BKLN (with various initial DER assumptions) and BIZD. We assumed an excess yield of 1.50% for this range of DERs based on insight from arbitrage BSL CLO and BDC financings and what BSL portfolios would reasonably yield.
The fund manager can also make their own inferences based on our sensitivity analysis between different DER and excess yield combinations shown in Table 3.
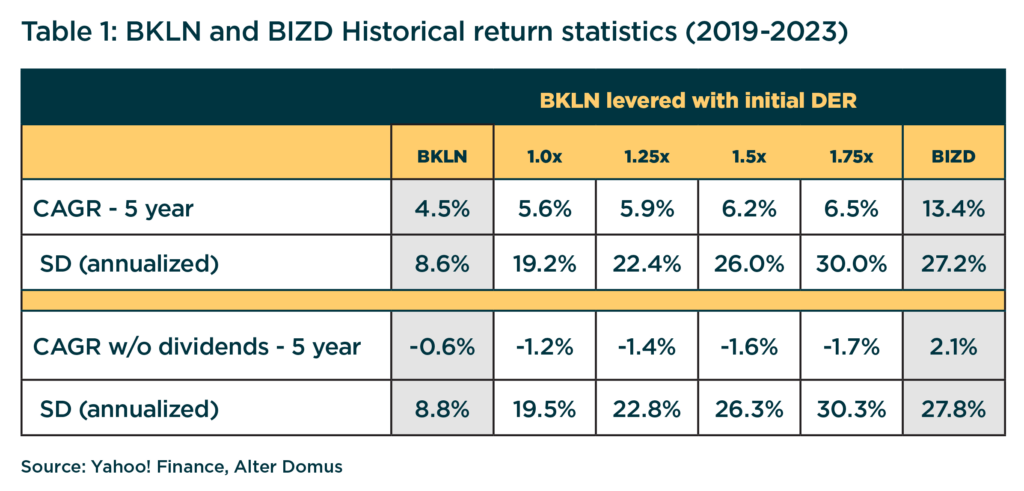
Initial observations indicate that the unlevered BKLN results are intuitive and to be expected as compared with BIZD. The BDC index returns appear to be relatively volatile but generated a higher CAGR over the period.
However, once leverage is introduced, and as to be expected, the BSL index returns imply more volatility, including a higher CAGR, as the assumed initial DER increases. But the CAGR increases at a relatively lower rate as compared to its volatility. Note that the volatility of the levered BSL index does, however, come closer to that of the BDC index.
Another noteworthy observation is that, for both indices, the dividend returns (representative of NII) contribute to most of the CAGR, even more so for BSL.
Amongst other factors, this is because the BSL index introduces primarily performing loans, which typically trade at or around par. In that case, there is limited upside in those instances when loan prices trade at a premium, reflecting the credit improvement of the borrower, as those loans will likely be pre-paid (or refinanced).
This phenomenon is especially the case for BSL borrowers as they are larger and have more access to alternative financing sources.
In contrast, private credit borrowers are typically smaller and often with a relatively riskier profile (most without public ratings) and hence less likely to find alternative sources to funding. However, these borrowers do compensate lenders with a relatively higher premium.
In this case, for those lenders (and investors) that can hold for the long-term (like BDCs), they can realize the rewards that the incremental premium these loans yield. BDCs will also often invest in equity securities, which offer some upside return potential.
Chart 1 illustrates the relative underlying performance.
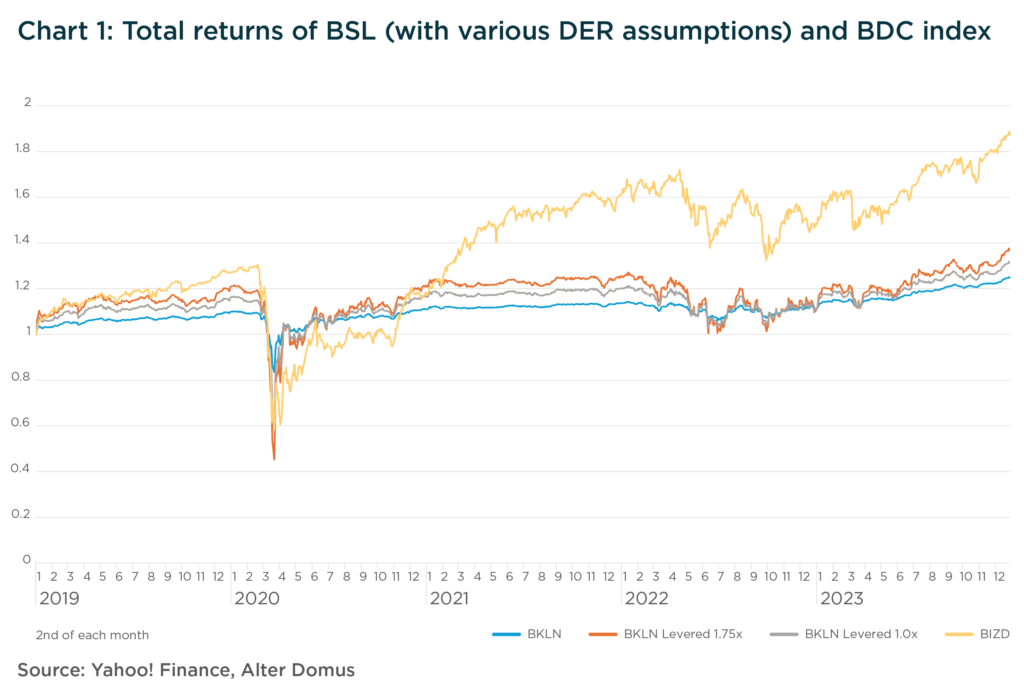
It is interesting to note that the BDC index and levered BSL index had similar drawdowns at the onset of COVID pandemic shutdowns during March 2020. However, as the BSL levered index appears to have recovered sooner, the BDC index accelerated later during 2021.
This can be partially explained by many BDCs having significant investments in subordinated assets including private equity that could offer some upside returns potential. In contrast, BSL had relatively limited upside with returns that ultimately relied on distributed NII. In fact, most of the increase in NII was due to the BSL floating base rates reflecting the Federal Reserve rate increases.
We also collected daily price and dividends for the BDCs that underlying the index. Chart 2 illustrates an example of how wide the range of BDC returns, for a sample of the BDCs in the index, were during this period.
This wide-ranging returns and volatility of performance among the BDCs can be explained, amongst other factors, by the diversity of portfolio compositions and prudent operational management exercised by the BDCs that could have further contributed to NII.
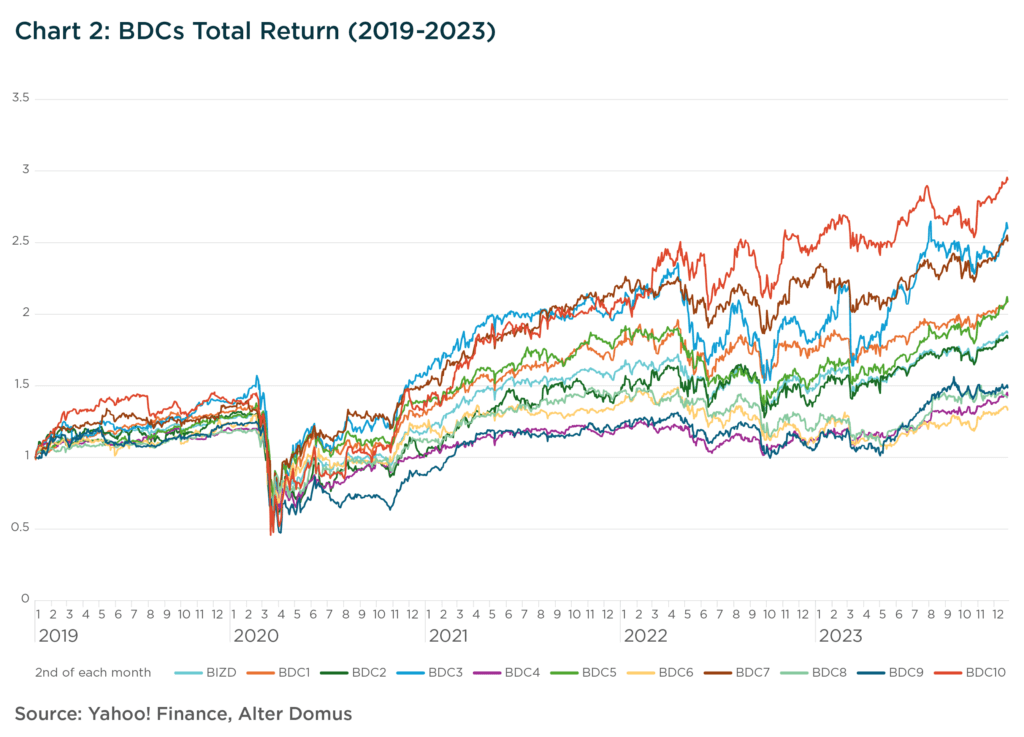
The range of CAGRs and volatilities for most BDCs analyzed within the index were between ~5% to ~21% and ~25% to ~43%, respectively.
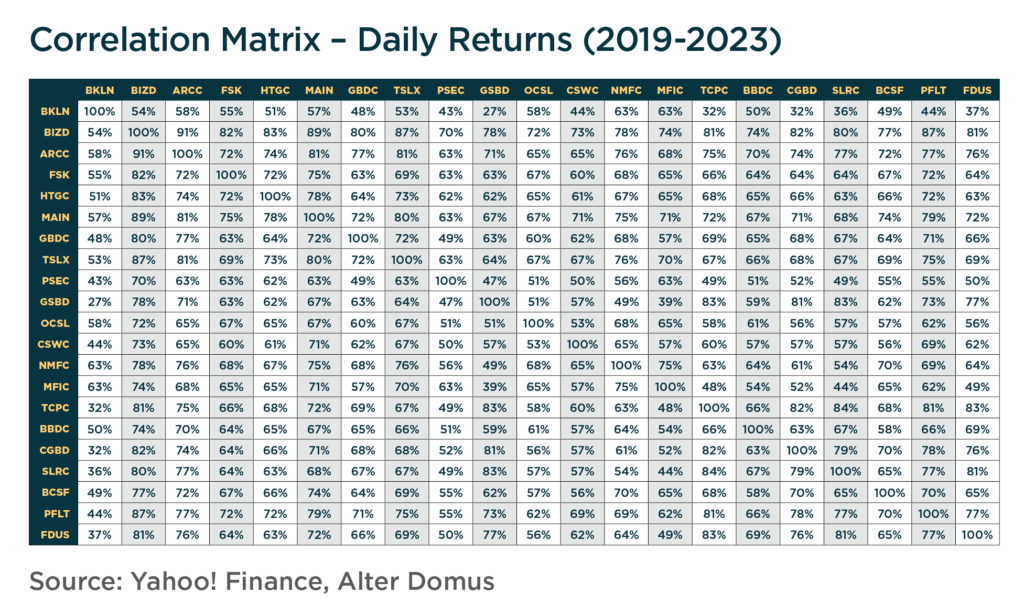
The daily return correlation matrix below provides further insight as to the diversity across the sample of BDCs and the BSL index. Although the BDCs are positively correlated with one another, the correlations imply that the BDCs returns do not always move with the same direction or of comparable magnitude. It also appears to correspond to Chart 2 above.
As another example, Chart 3 displays a comparison of returns for two BDCs with quite different portfolio compositions (based on posted Q4 2023 earnings presentations).
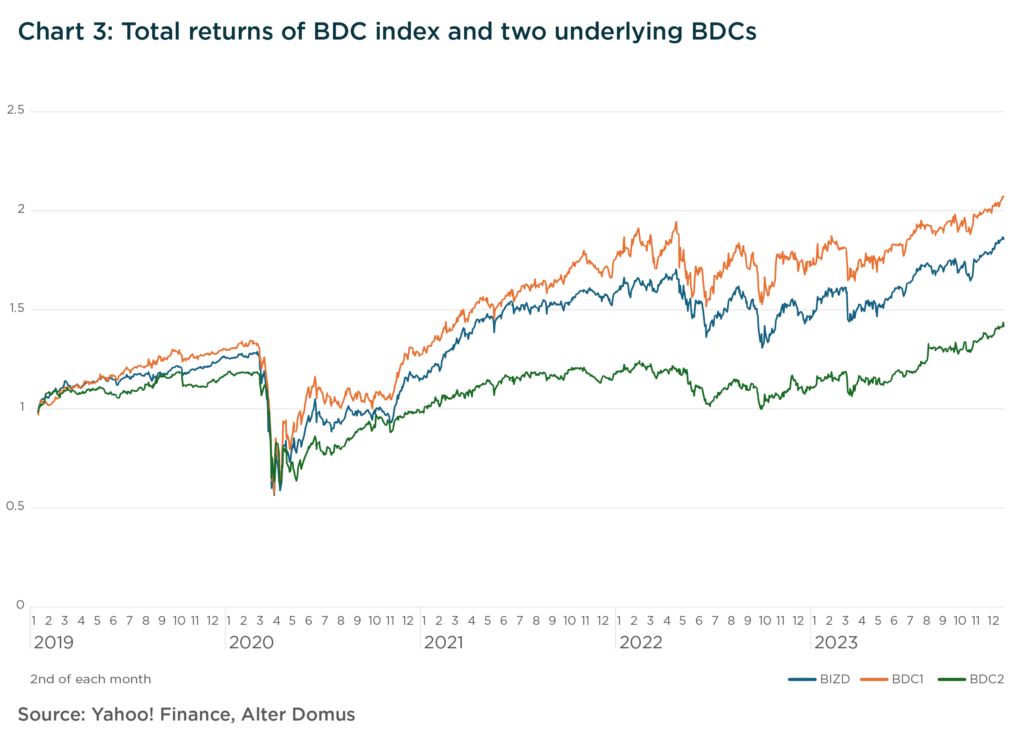
Note that the BDC with a higher CAGR (and higher volatility) had significantly more exposure to investments outside of first-lien senior secured loans. Approximately 50% of that BDC portfolio included a combination of second-lien or subordinated loans and equity type investments.
The other BDC had an investment portfolio comparable to a typical direct-lending portfolio with more than 90% first-lien secured loans. The chart is not surprising as it would be expected that riskier portfolios could generate higher returns along with more volatility, holding all else equal.
Chart 4 compares the second BDC mentioned above with the BSL index since this BDC had a more comparable portfolio composition, at least in terms of seniority.
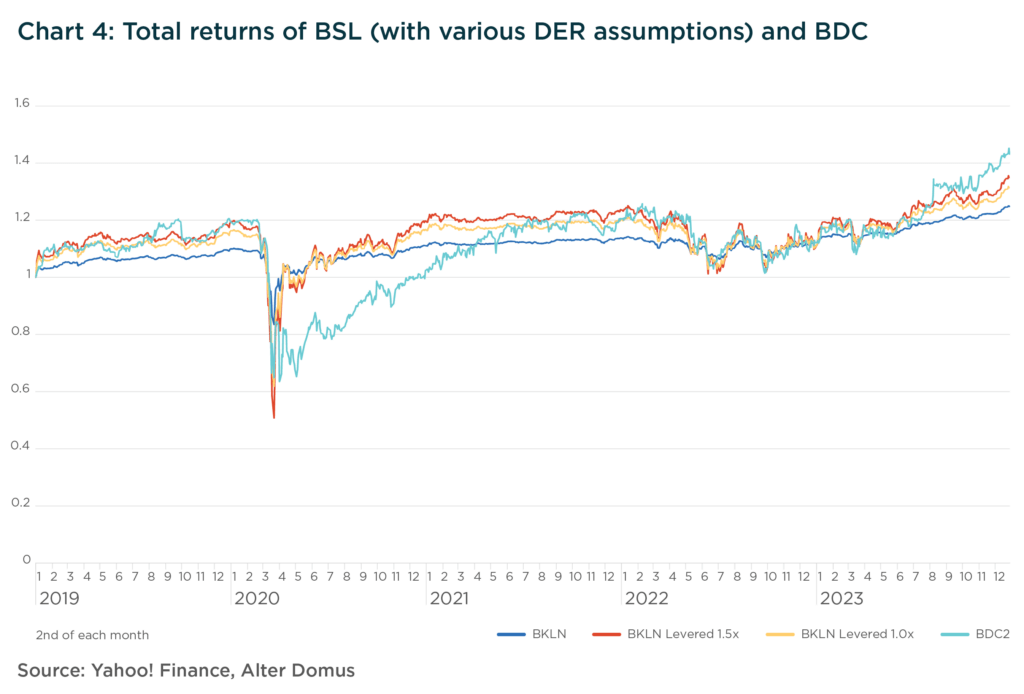
At first glance, the levered BSL returns give some intuitive explanation as to the behavior of the BDC. Also, one can argue that this BDC was riskier with more volatility (at least during 2020), however, this volatility could be explained by a variety of factors, including the fact that the underlying assets are less liquid and generally considered to pose more credit risk than BSLs (of course, with more risk comes higher expected returns). One proxy of market volatility for BDC assets could be the divergence between market price and fair value as applied by BDCs in accordance with their established valuation methodologies.
Underlying investments within BDCs are mostly illiquid and private in nature and hence do not have readily observable market prices. In fact, BDCs report portfolio NAVs quarterly and mainly rely on established fair value determinations for portfolio investments.
History has shown that market prices could deviate from NAVs (for other less liquid and fairly valued asset classes as well) especially so during extreme times of market distress, implying a significant discount. This was the case for BDCs during early 2020, at the onset of COVID.
Alternatively, there are moments where this deviation can work in the other direction (i.e., in cases of market euphoria with market prices implying a premium to NAV) only exacerbating market implied volatility. Periods of significant discounts or premiums to NAV could provide some explanation as to the differences in volatility across BDC investments and BSLs.
Table 2 below illustrates how BDC discounts drifted during our period of analysis with discounts as low as 50% in March 2020, with a subsequent rebound to an average modest premium at the end of our assessment period.
Table 2: BDC Discount / Premium to NAV
| As of | Average Discount / Premium |
|---|---|
| 12/31/2018 | ~10% Discount to NAV |
| 3/31/2020 | ~32% Discount to NAV |
| 12/31/2023 | ~3% Premium to NAV |
Averages are based on a sample of eight BDCs (ARCC, FIDUS, FSK, GBDC, HTGC, PSEC, TSLX, and OBDC (NA on 12/31/2018)).
As already noted, we utilize the levered BKLN analysis to further demonstrate how the NII and DER are critical in explaining CAGR performance. Table 3 shows the relative sensitivity of CAGR (and volatility) based on various combinations of DER and excess yield assumptions.
Table 3: Levered BSL ETF with varying DER and excess yield assumptions
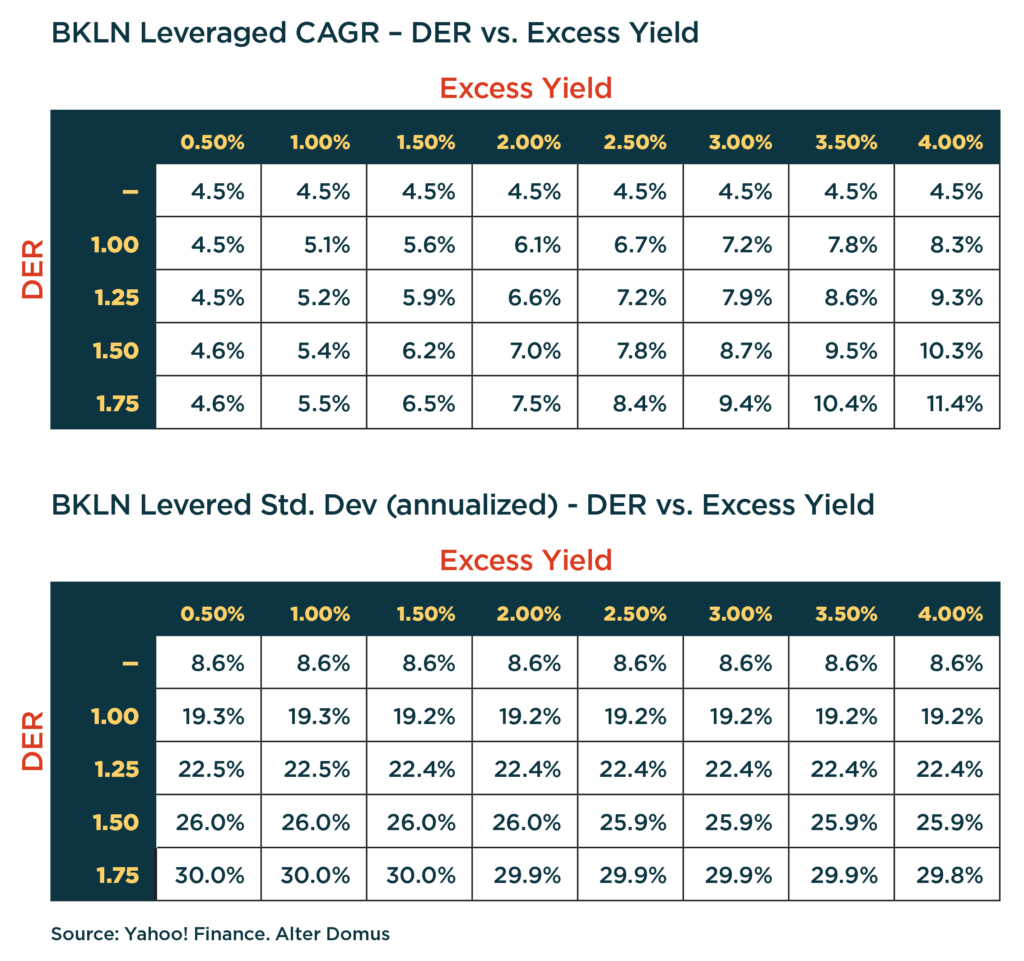
The CAGR results are not surprising – CAGR increases when the DER and/or excess yield increases. The CAGR changes are more muted for lower excess yield assumptions (e.g., 0.50%) as more leverage is added.
Volatility, on the other hand, increases quite significantly as DER increases for each assumed excess yield, but is less sensitive to changes in excess yield while holding DER constant. In this case, the daily price returns explain most of the changes.
The above results are insightful when comparing the levered BSL index return statistics against the BDC index. Based on the historical returns during this period, the CAGR (and volatility) comparisons between the levered BSL index and BDC index converge closer when approaching a 4.00% excess yield and a 1.75x DER.
However, this would have been an unlikely scenario for a levered BSL portfolio (especially the 4.00% excess yield).
Considerations for understanding BDC return variation
Bringing this together, we present some key factors that can account for the variation in historical return performance across these BDCs. Some are likely topics for further Alter Domus research.
Dividends and NII:
It is quite clear how significant dividend distributions (representative of NII) contribute to the CAGR of a BDC as was demonstrated through a simple example. This further highlights how important the operational management of the BDC is to CAGR as is the manager’s investment decisions (e.g., level of diversification and credit risk).
Some examples include the efficient management of the BDC’s asset-liability structure (e.g., maturity profiles, payment mismatches, debt servicing cost), operating costs, and level of management fees.
Historical observation period:
Although the period during which these historical returns cover is a significant one, it is nonetheless a sample. A particular vintage or timing of investments such as at the beginning, end or middle of a business cycle can be a key reason for performance.
Market price versus NAV:
The historical returns are based on observed market prices, which can be divorced at times from what the underlying NAVs may indicate. This is especially the case for BDCs whose underlying assets are predominantly private in nature and where the NAVs typically rely on fair value determinations, as mentioned earlier.
Hence those prices implied by the market can be relatively more volatile during times of turbulence and illiquidity, particularly for the equity security of a BDC, or alternatively during times of market euphoria. It is important to emphasize, BDCs are typically not directly exposed to day-to-day market price movements as BDCs have a relatively stable asset-liability profile in contrast to regulated banks, for example.
BDC index:
The index underlying the BIZD ETF represents a subset of the BDC market and includes those BDCs that are larger, more liquid, and publicly traded. As of 2023, BDCs represented about $315 billion of AUM, where roughly half of that was publicly traded BDCs.
Furthermore, BDCs represent a small subset of the larger private credit market (of almost $2 trillion). While BIZD could be a reasonable proxy for the investable BDC market, it may not be suitable in all cases for the entire private credit markets.
Final thoughts on BDCs as a Diversification Opportunity
We have previously demonstrated through observations that BDC portfolio compositions can vary significantly based on different metrics. This portfolio variation can provide investors opportunities to better manage across the risk/return and portfolio diversification spectrums.
As BDCs consist predominantly of private credit, we have also highlighted in previous research key features that can mitigate risks within the private credit market while providing investors and borrowers a valuable alternative.
In this paper, we took a simple approach in our analysis for evaluating the historical performance across BDCs. We also made use of BSL portfolio performance, adjusted for leverage comparable to BDCs, to provide further insight. We relied on public market data for our analysis based on ETFs that track the performance of established BDC and BSL indices. We also included return performance for a sample of BDCs that underly their relevant index.
Our review shows that diversity across BDC portfolios can present a range of long-term risk/reward opportunities. The observed correlations further reflect the benefits of variation in portfolio compositions across BDCs.
Thus, BDCs could provide additional diversification benefits to a fixed income portfolio. As we have noted amongst other factors, the ongoing operational management of any BDC is also an important consideration to BDC returns as is of course the more observable asset manager’s credit and portfolio management acumen.
[1] To be clear, BIZD is an unlevered ETF, which passes through the returns of the underlying BDCs, and hence no further adjustment is made.


